Figure 8.
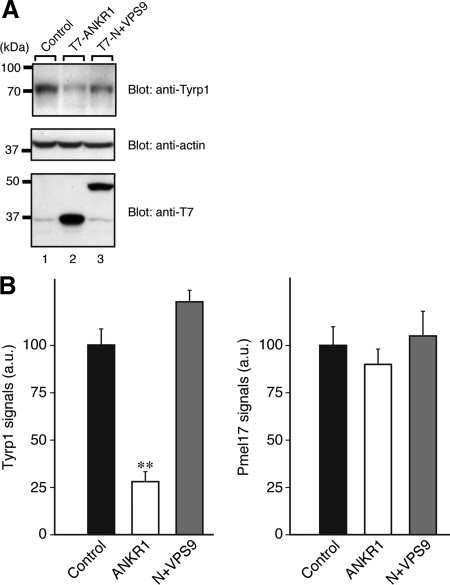
Reduced expression of Tyrp1 in Varp-ANKR1-expressing melanocytes. (A) Reduced expression of Tyrp1 in Varp-ANKR1–expressing melanocytes as revealed by immunoblotting. Cell lysates of B16-F1 cells expressing either T7-Varp-ANKR1 or T7-Varp-N+VPS9 (∼30 μg) were subjected to 10% SDS-PAGE followed by immunoblotting with anti-Tyrp1 antibody (1/200 dilution), anti-actin antibody (1/400 dilution), and anti-T7 tag antibody (1/5000 dilution). The positions of the molecular mass markers (× 10−3) are shown on the left. (B) Reduced expression of Tyrp1 in Varp-ANKR1–expressing melanocytes as revealed by immunofluorescence analysis. Note that expression of Tyrp1 in Varp-ANKR1–expressing cells dramatically reduced, whereas expression of Pmel17 had no effect. Expression of Tyrp1 in Varp-N+VPS9–expressing cells was slightly increased in comparison with the control cells, but this was not statistically significant under our experimental conditions. The bars represent the means ± SE of data from three independent dishes (n > 50). **p < 0.01, Student's unpaired t test.

