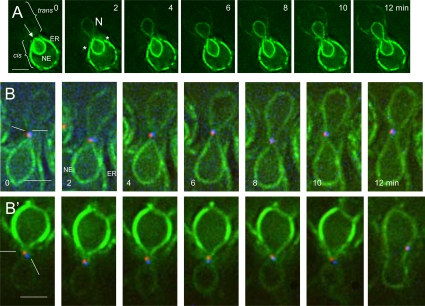
Figure 2.
Transit of HMG1-GFP. (A) Time course of transfer of HMG1-GFP from (ATY1529) to a nonfluorescent recipient (ATY2112). Note the parting of the apex of the cis-NE (arrow), followed by the appearance of signal in the trans-NE before it acquires equal intensity in the trans-cortical ER. The increase in intensity of HMG1-GFP in the trans-NE is gradual. See Supplemental Figure S2 for a further example. The asterisks indicate the abrupt interruption of the cortical ER signal. (B and B′) Crosses between a strain expressing HMG1-GFP and Spc42p-mRFP (ATY3525) with a strain expressing Spc42p-CFP (ATY1455). Note the position of the SPB sentinels of distinct parentage during HMG1-GFP transfer. In many images they flank the axis of transfer.

