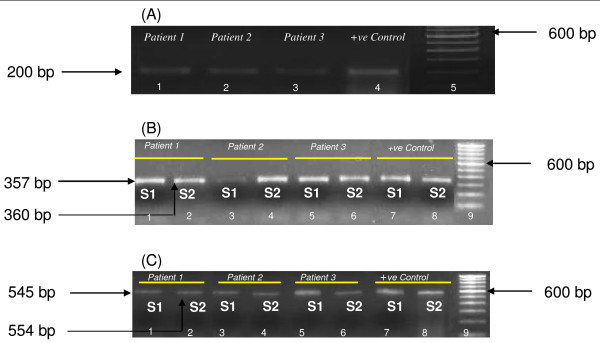
Figure 1.
PCR detection of incB and incC genes in endocervical samples of CT-positive patients. (A) Gel showing 200 bp amplicons of CT plasmid. Lanes 1, 2, 3 – PCR positivity in patients 1, 2, 3 respectively; lane 4- positive control; lane 5- 100 bp Ladder (Invitrogen). (B) Agarose gel showing PCR positivity for CT-incB gene. Lanes 1, 3, 5- incB S1 PCR amplicons in patients 1, 2, 3 respectively; lane 7-positive control; lanes 2, 4, 6 – incB S2 PCR amplicons in patients 1, 2, 3 respectively; lane 8-positive control; lane 9 is 100 bp Ladder (Invitrogen). (C) Agarose gel showing PCR positivity for CT-incC gene. Lanes 1, 3, 5-incC S1 PCR amplicons in patients 1, 2, 3 respectively; lane 7-positive control; lanes 2, 4, 6 – incC S2 PCR amplicons in patients 1, 2, 3 respectively; lane 8-positive control; lane 9 is 100 bp Ladder (Invitrogen).

