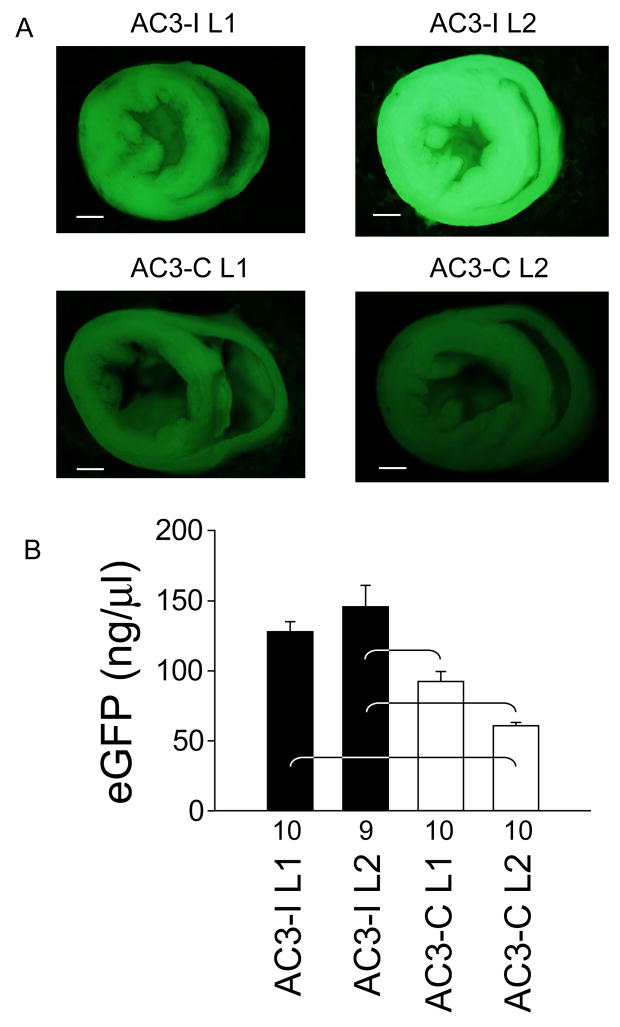
Figure 1. eGFP expression in AC3-I and AC3-C mice.
aTransverse hemi-sections of line 1 (L1) and line 2 (L2) whole hearts obtained from AC3-I and AC3-C mice under fluorescent illumination at 2X magnification. The exposure times were equal for all panels and the calibration bar equals 1 mm. b. Summary data for eGFP concentrations measured in whole heart homogenates. Numerals on the abscissa indicate the number of hearts studied in each group. eGFP concentrations were significantly different between groups (†p <0.001). The brackets indicate significant (P<0.05) post-hoc comparison differences.

