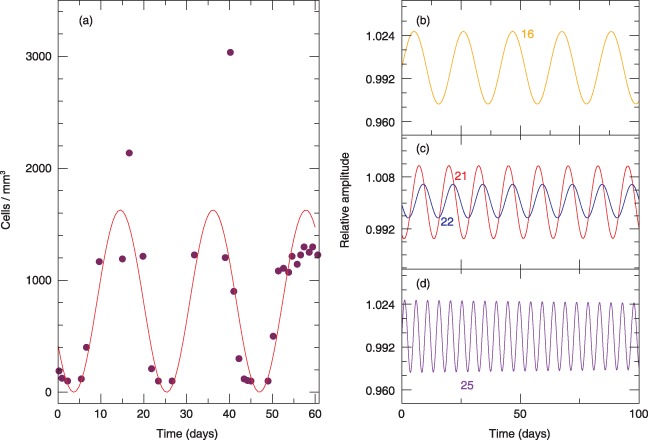
Figure 4.

Superimposition of neutrophil cycling (solid curve) as predicted by the model, with experimental data taken from Hammond et al. ( 6 ) (solid circles). Normal range for neutrophils is 1.9–7.0 × 10³/mm3. (a) Simulation is for a mutation that appears in compartment j = 21 with a period T = 21 days. In (b) to (d), we show simulations of cycling frequency due to hypothetical mutations that occur in upstream (j = 16) or downstream compartments (j = 25).
