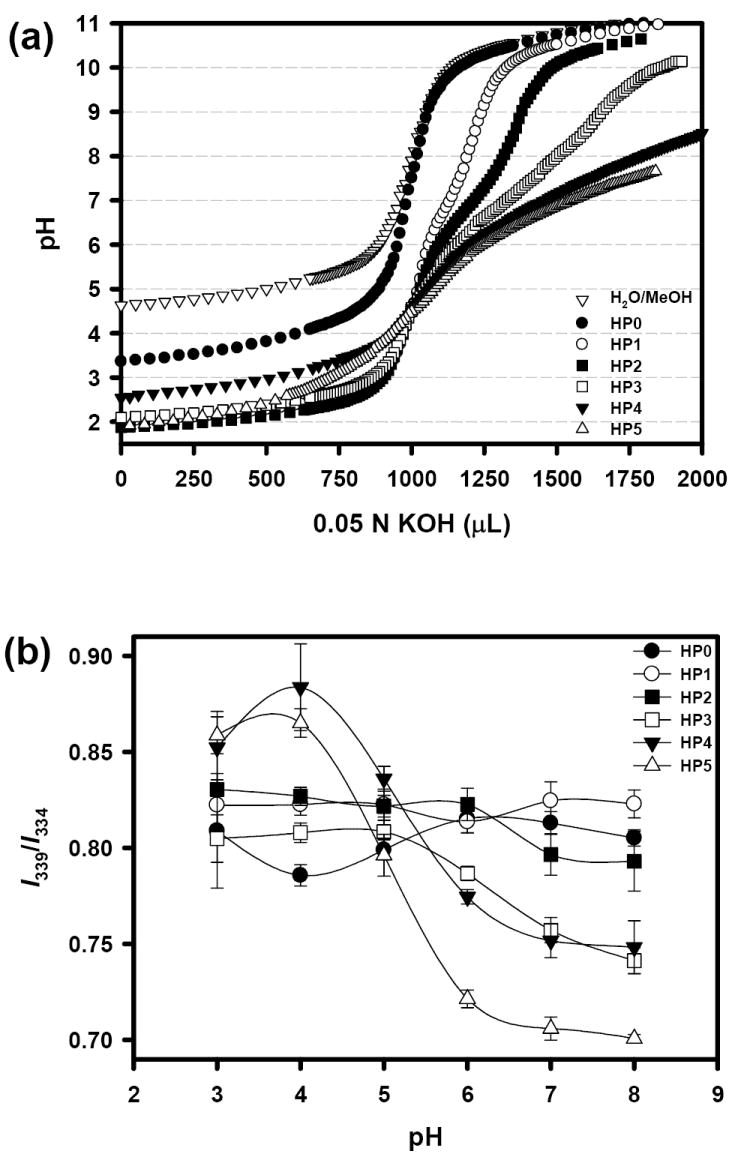
Fig. 2.

Acid-base titration curves for blank (methanol:water=1:1) and six hydrotropic polymers (HPs) (a), and the pyrene study monitoring the pH-sensitivity of HP micelles (b). The low value of I339/I334 represents the micelle destabilization. (n = 3).
