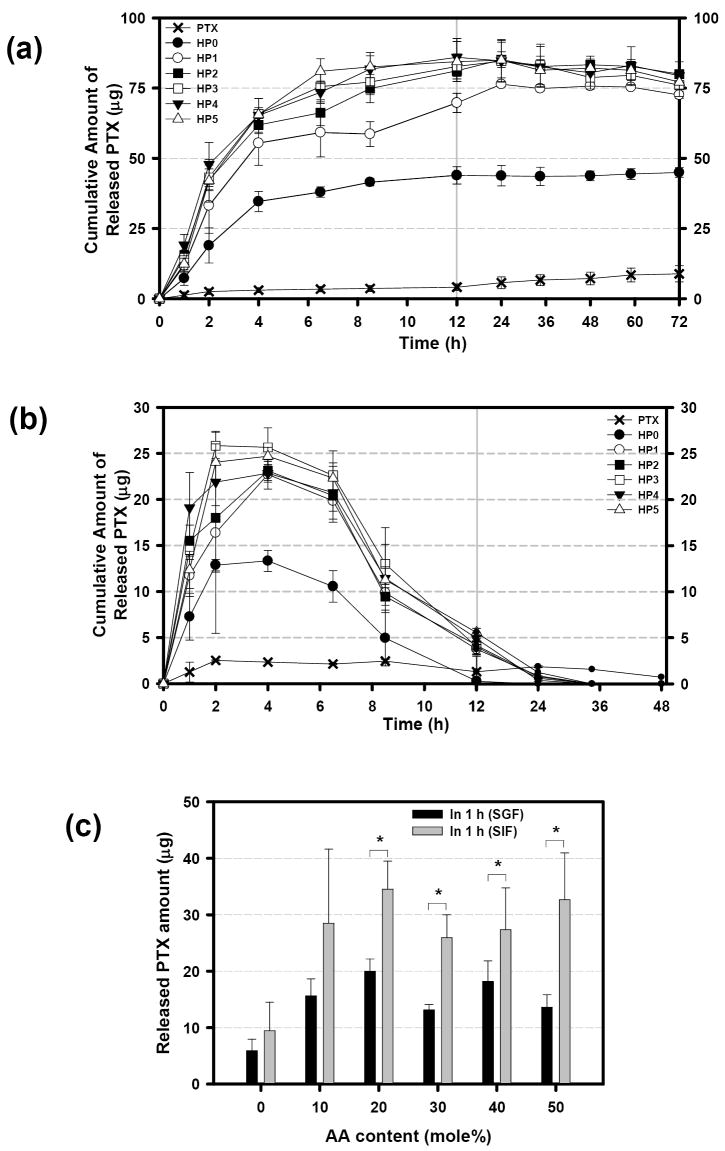
Fig. 5.
Cumulative amount of the released PTX as a function of time in SIF (a) and in SGF (b). (n = 3). The amounts of PTX release in SGF (0-1 h) and in SIF (1-2 h) are compared to determine the difference of release rate in both solutions (c). The asterisk indicates that there exists statistical significance (one-way ANOVA P < 0.05, c)

