
Figure 3.
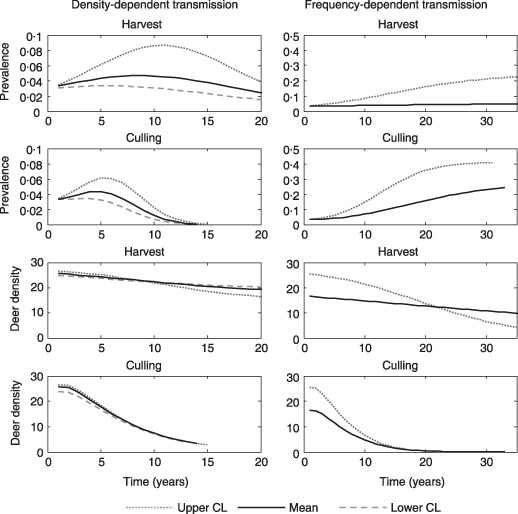
Prevalence and deer density dynamics (deer mi−2) after CWD detection in south‐central Wisconsin under harvest and culling strategies. Lines show the predicted trajectories for the mean, upper, and lower confidence intervals for the estimated transmission coefficients. Note different time‐scales for density‐ and frequency‐dependent transmission models.