
Fig. 2.
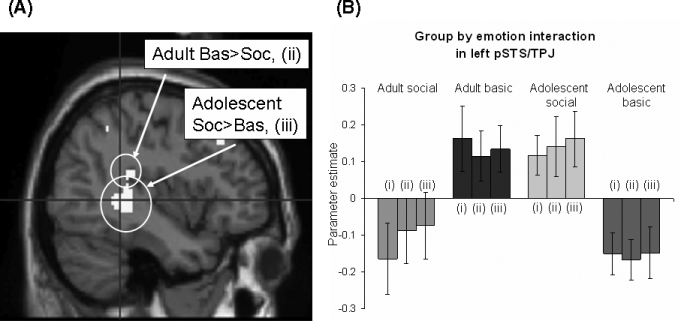
Interaction between group, emotion and arMPFC activation in left pSTS/TPJ. (A) Region showing significant interaction between group (adolescent vs. adult), emotion (social vs. basic) and activity in anterior rostral MPFC, shown at P< 0.01 projected onto a sagittal T1 image. Crosshair is at peak voxel [−40 −42 2]. Regions in which there was also a main effect of social vs. basic emotion within each group separately are circled. (B) Graph showing parameter estimates for this interaction. Key: (i) peak voxel [−40 −42 2]; (ii) secondary peak voxel [−44 −34 10]; (iii) secondary peak voxel [−38 −34 20].