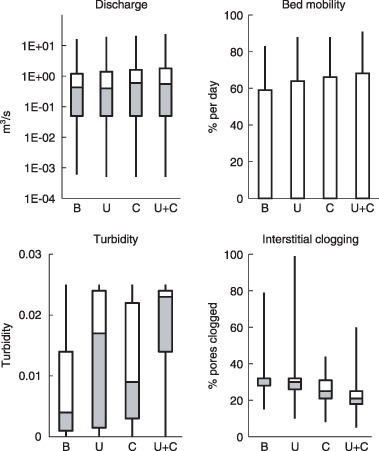
Figure 4.

Hydrologic and geomorphic submodel outputs under four scenarios: Baseline (B), Urbanization Alone (U), HadCM3‐B2 Climate Change (C), and Urbanization plus HadCM3‐B2 Climate Change (U+C). Submodels were run for the years 2085–2094. Whiskers represent minimum and maximum values, boxes represent first and third quartiles, and dividing line represents median of Discharge, Bed Mobility, Turbidity, and Siltation over the 10‐year simulations.
