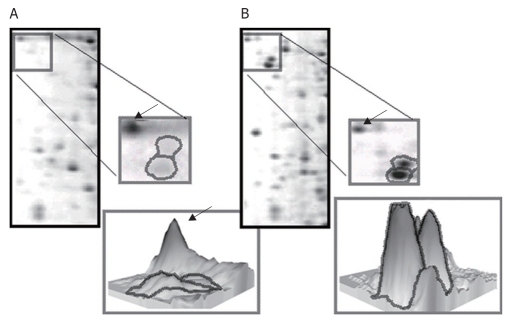
Figure 1.
Two-dimensional gel electrophoresis identifying increased amounts of NFAT2 in UC colonic mucosa tissue. Tissue protein lysate was prepared from normal (A) and UC affected colon tissues (B) and separated using two-dimensional gel electrophoresis (2-DE). Spot identification and matching across the gels and determination of the relative amount for each corresponding protein spot were conducted using the software, Progenesis workstation (non-linear). Proteins were identified using mass spectrometry as previously described[30]. The representative results of 2-DE are shown. The inserts are the close views along with the 3-dimensional pictures of NFAT2 and the reference protein spot on the 2-DE. Arrows indicate the reference protein spots across gels. The grey lines outline the NFAT2 spots.

