
Figure 2.
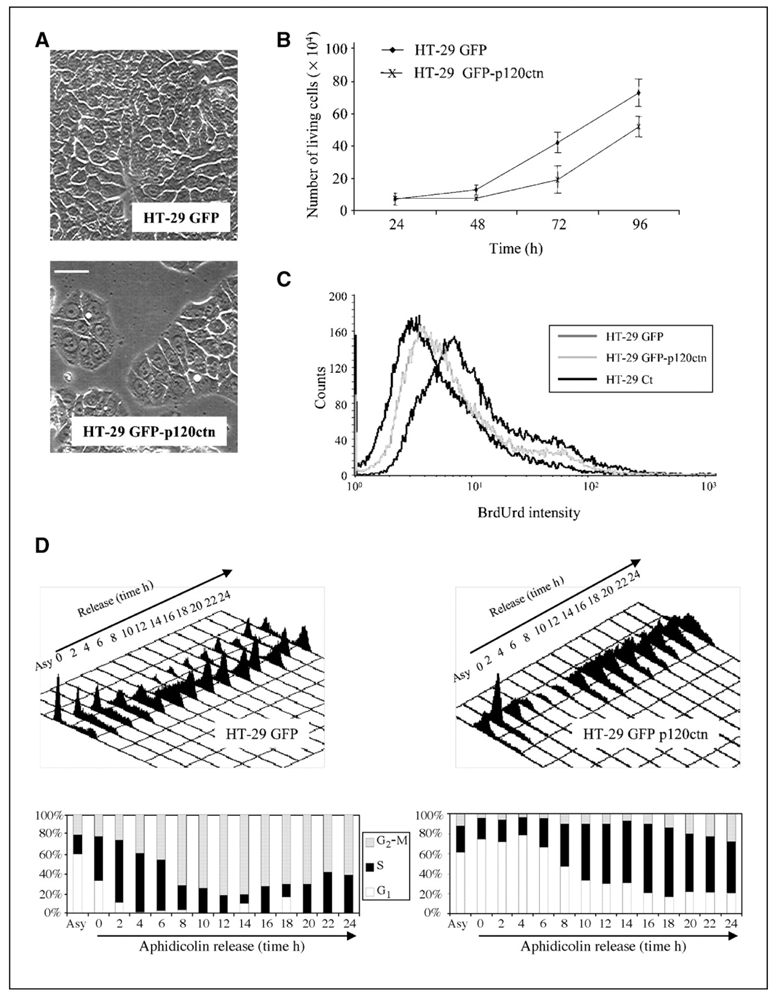
Overexpression of p120ctn slows down HT-29 cell proliferation. A, HT-29 GFP and HT-29 GFP-p120ctn cells were cultured for 120 h and observed under phase-contrast microscopy. Bar, 50 μm. B, HT-29 GFP and HT-29 GFP-p120ctn cells were seeded at 2 × 10⁴ cells per well, grown for the indicated times and living cells, then counted using trypan blue solution. Points, mean of three independent experiments; bars, SE. C, BrdUrd incorporation assay. BrdUrd (5 μmol/L) was added for 15 min to the culture medium of 24-h precultured HT-29 GFP (dark gray line) or HT-29 GFP-p120ctn (gray line) cells. After fixation and BrdUrd immunostaining, positive cells were counted using a Becton Dickinson Facstar flow cytometer. Control cells non–treated with BrdUrd were used as negative control (black line). D, top, HT-29 GFP (left) or HT-29 GFP-p120ctn (right) cells were synchronized at G1-S transition with aphidicolin (5 μg/mL, 24 h) and released in fresh medium for the indicated time. DNA content was then analyzed by FACS after propidium iodide staining. Bottom, histograms indicate the percentage of cells in G1, S, and G2-M phases. Asy, asynchronized.