
Figure 4.
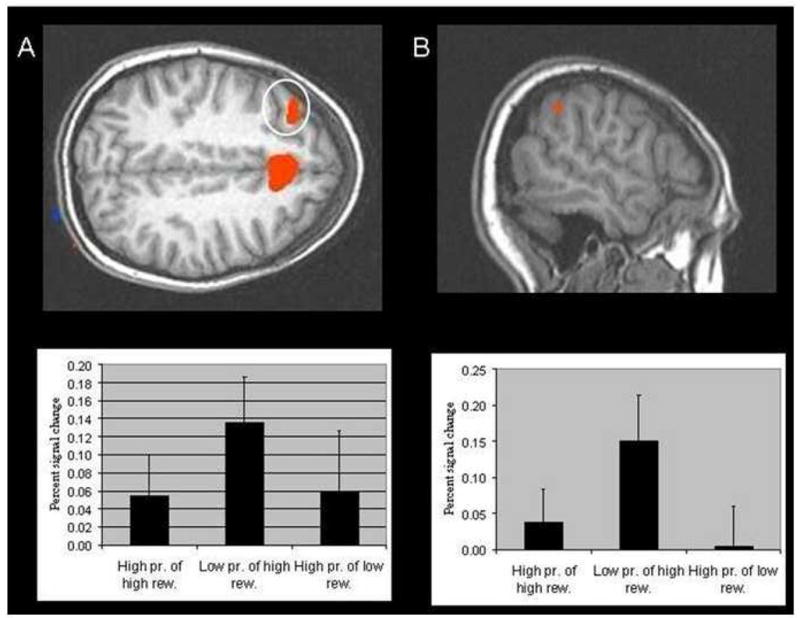
(A) Region of middle frontal gyrus activation (−34, 29, 42) showing greater BOLD responses for low-probability as opposed to high-probability selections (Table 3); (B) Region of intraparietal lobule (−55, −46, 40) that showed greater BOLD responses for ‘risky’ as opposed to ‘safe’ selections (Table 3). The associated percent signal changes from baseline for each of these regions are shown immediately beneath.