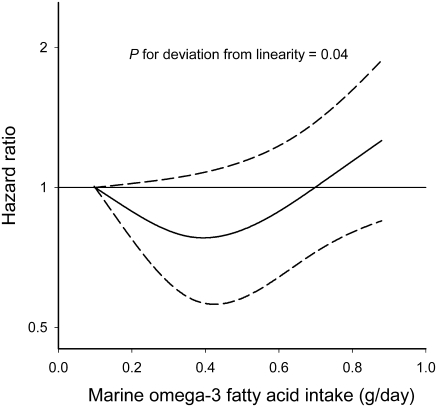
Figure 1.
The solid line represents hazard ratio and the dashed line represents the 95% confidence intervals. The curve was produced from a Cox proportional hazards model where marine omega-3 intake was modelled as a restricted cubic spline with three knots, the baseline hazard was allowed to vary by age, and the hazard ratio was adjusted for body mass index, physical activity, energy, alcohol, fibre, sodium, and red or processed meat consumption, education, family history of myocardial infarction at <60 years, cigarette smoking, marital status, self-reported history of hypertension, and high cholesterol.

