
Figure 3.
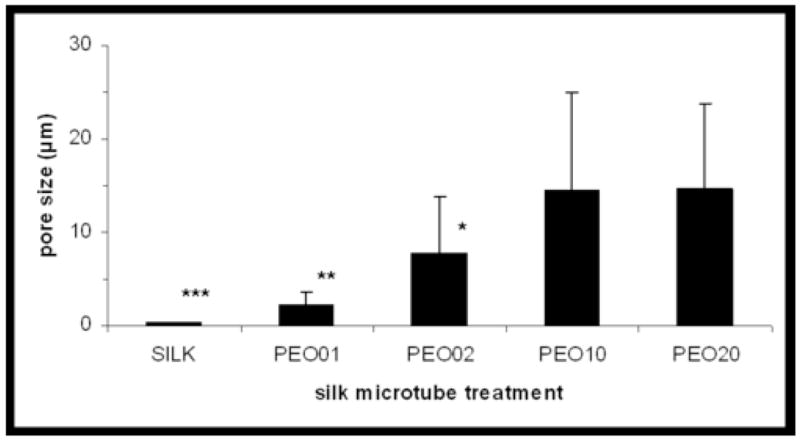
Pore sizes (μm) of silk fibroin/PEO blend microtubes as a function of microtube treatment. Surface pore sizes of the silk microtubes of different silk fibroin/PEO blends were measured and quantified both along the tube surface and cross-section using SEM images and ImageJ software. Microtube treatments are given either as 100% silk fibroin (SILK) or according to wt % of PEO in a silk fibroin/PEO blend (e.g. PEO01 represents a 99/1 wt % silk fibroin/PEO blend). * indicates P<0.01 with PEO10, PEO20; ** indicates P<0.01 with PEO02, PEO10, PEO20; *** indicates P<0.01 with PEO01, PEO02, PEO10, PEO20 (two-sample t-test).