
Figure 2.
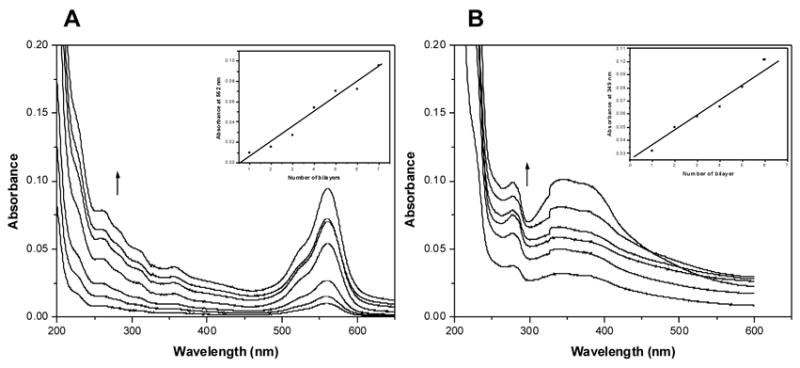
UV-Vis absorption spectra of (A) (silk/RH)n and (B) (silk/AA)n multilayered thin films on quartz slides as a function of the number of bilayers. The arrows indicate the increase of the number of bilayers. The insets show linear increases of the characteristic absorption peaks of Rhodamine B and Azoalbumin in A and B, respectively. Note: RH=Rhodamine B; AA=Azoalubmin.