Figure 3.
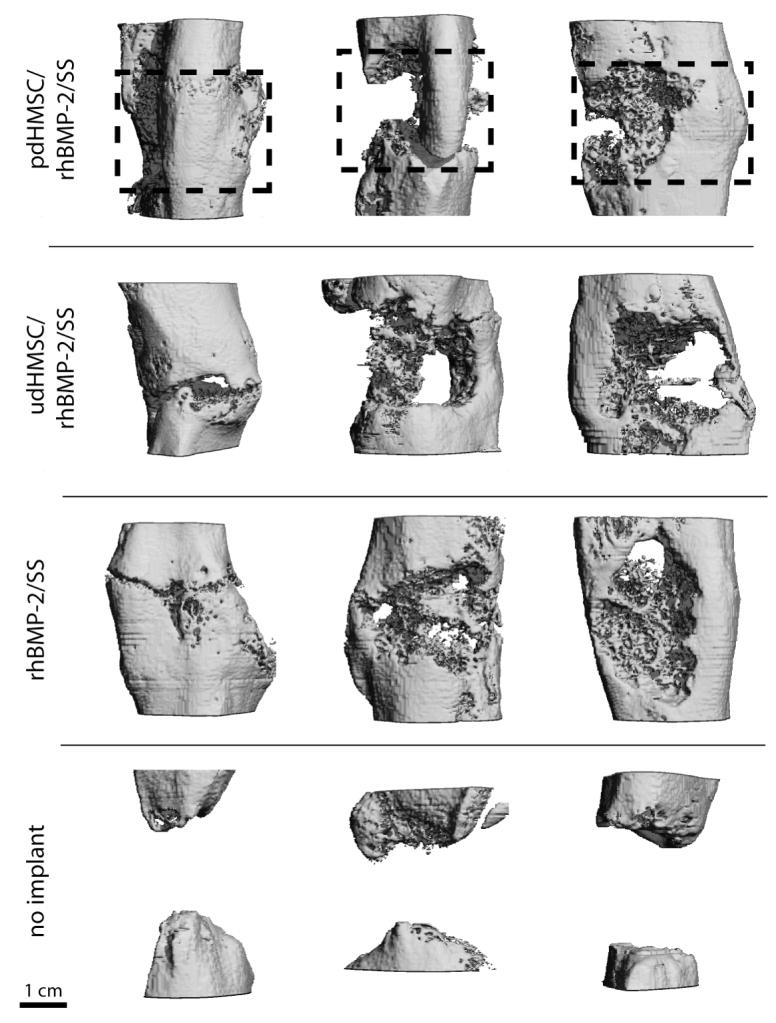
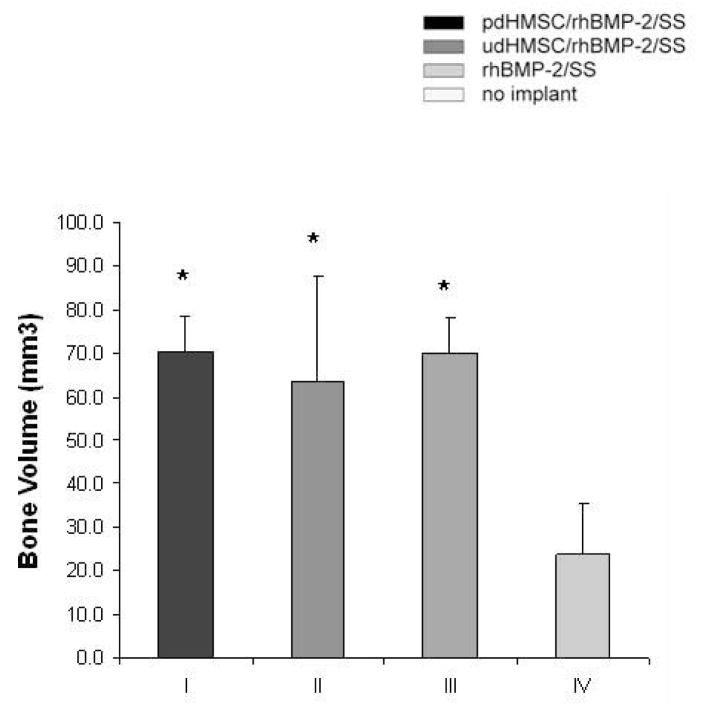
(A) Micro-computed tomography from three representative rat critical size femoral defects for each treatment group 8 weeks after surgery. The dotted box approximately indicates the original defect zone. (B) Morphometric analysis (bone volume per defect,[mm3]) of new bone formation from rat critical size femoral defects 8 weeks after surgery, and treated with pdHMSC grown for five weeks on rhBMP-2 loaded silk scaffolds (group I), rhBMP-2 loaded silk scaffolds seeded with udHMSC (group II), unseeded rhBMP-2 loaded silk scaffolds (group III), and untreated (control) defects (group IV). Error bars reflect 1 standard deviation. * Significantly (p<.05) greater than group IV data.


