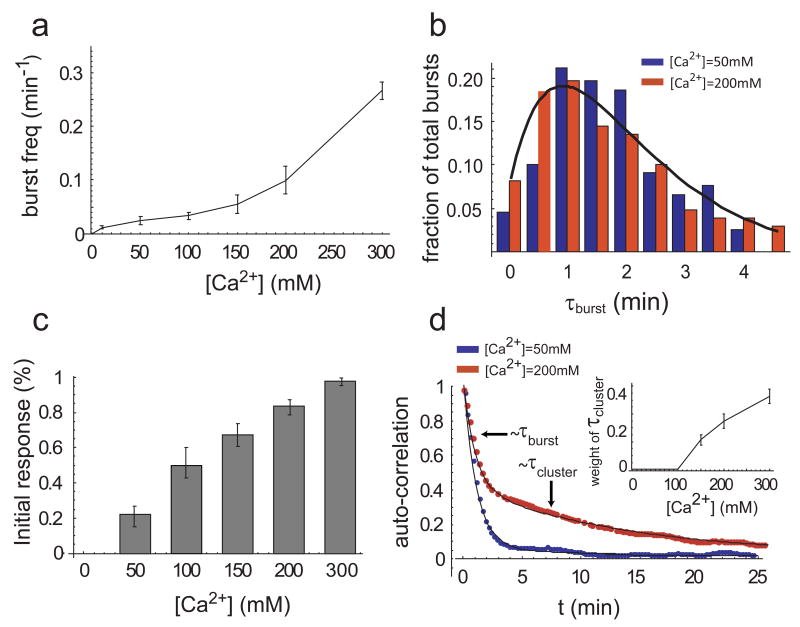
Figure 2.
Calcium modulates the frequency, but not the duration, of Crz1 nuclear localization bursts. a, Frequency of bursts increases with calcium concentration (error bars calculated by using different thresholds for burst determination, see Supplementary Information). b, Burst duration is independent of calcium concentration. Normalized histograms, h(t), of total burst duration at two calcium concentrations are both well-fit by h(t) = t e−t/τ, with τ = 70 sec (black line). c. The proportion of cells that respond rapidly to extracellular calcium increases with the calcium concentration. Bars represent the fraction of cells with nuclear-localized Crz1 within 15 minutes of addition of calcium. d, Average auto-correlation functions of localization trajectories (N=58 and 85 cells respectively) from a population of cells at two calcium concentrations. At low Ca2+ concentrations (blue, 50mM), the autocorrelation can be well-fit by a single exponential with timescale τburst≈60s, whereas at high Ca2+ concentrations (red, 200mM), two time scales of fluctuations emerge, τburst≈ 60s and τcluster≈ 720s, corresponding to isolated and clustered bursts, respectively. Inset shows the relative weight of the clustered bursts, which appear at Ca2+ concentrations greater than 100mM and increase in frequency as calcium increases. Error bars are estimated from bootstrap.

