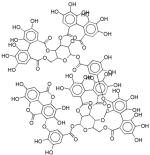
Table 1.
Scores specifications of the low density regions and with typical structure examples.
| Region | tPS1†† | tPS2‡‡ | tPS3§§ | tPS4*** | Example |
|---|---|---|---|---|---|
| I | <−5 | - | - | - |

|
| II | −3.5 – −2.5 | −0.5 – 0.5 |

|
||
| III | - | >6 | - | - |

|
| IV | 0 – 4 | −1.5 – −1 | - | - |

|
| V | 7.5 – 12.5 | −1 – 1 | - | - |

|
| VI | 5 – 10 | −2 – −3.5 | - | - |

|
| VII | <5 | - | - | >4 |

|
| VIII | <10 | - | - | <−1.5 |

|
| IX | 10–30 | - | - | <0 |

|
| X | >30 | - | - | - |

|
Predicted scores in component 1
Predicted scores in component 2
Predicted scores in component 3
Predicted scores in component 4
