
Fig 1.
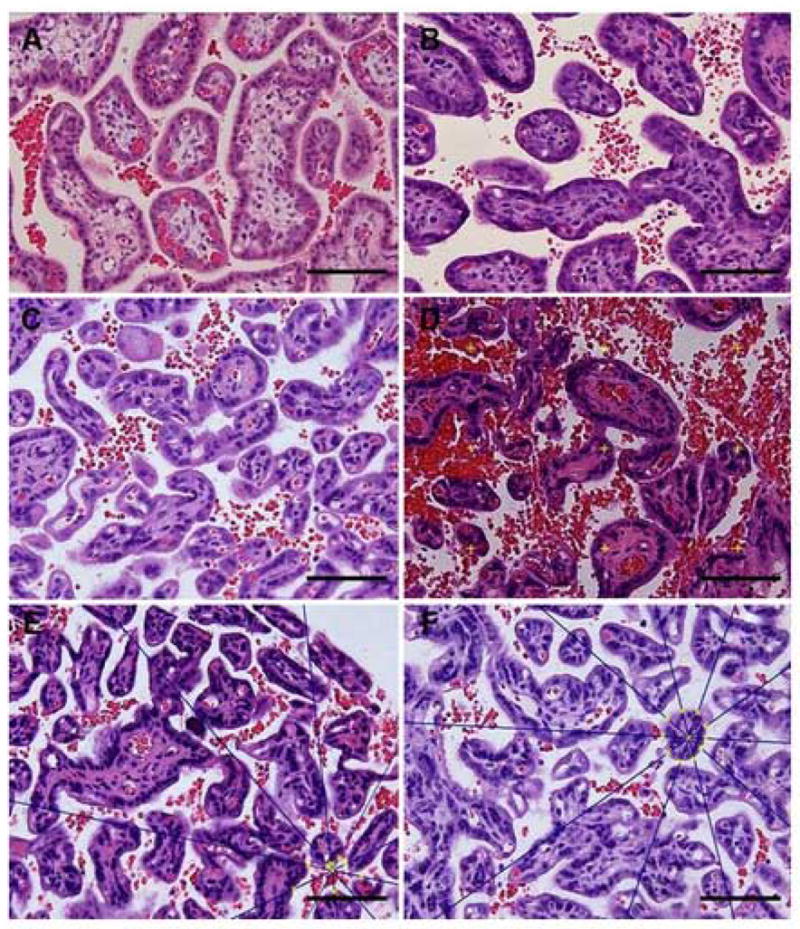
shows representative micrographs of placentas from control (1A & 1C) and nutrient restricted placentas (1B & 1D) at 90 and 165 days gestation respectively. Methods for calculating star volume for IVS (1E) and villi (1F) are shown. Bar=100 micrometer.