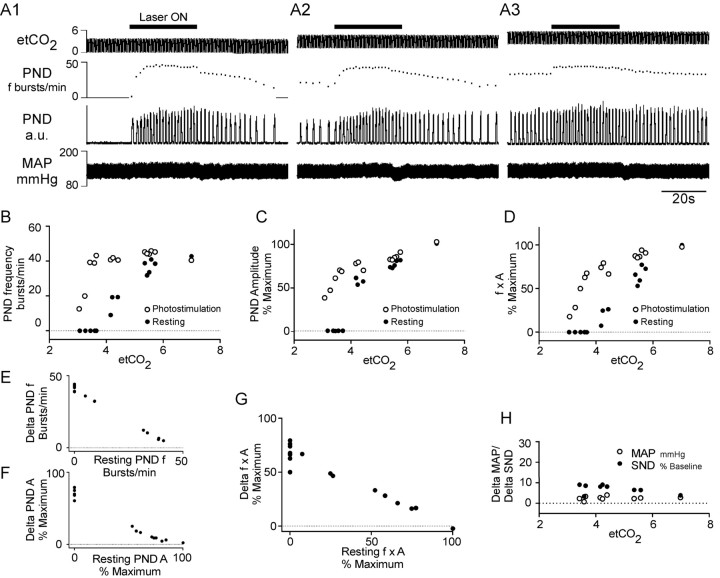
Figure 3.
Cardiorespiratory effects produced by photostimulation of ChR2-expressing RTN neurons in one rat. A, Pulsed laser light (473 nm; 10 ms, 20 Hz) was applied for 30 s every 2 min to the ventrolateral medulla through a 200-μm-thick fiber optic while the end-tidal CO2 (etCO2) (top trace) was set at various levels. Shown are the effects of the photostimulation (laser ON; horizontal bars) on phrenic nerve discharge frequency (PND; second trace from top), PND amplitude (rectified and integrated with 0.015 s time constant; third trace from top), and arterial pressure (AP) (fourth trace). Episode A1 was recorded while etCO2 was below the apneic threshold, episode A2 while etCO2 was just above the apneic threshold, and episode A3 while etCO2 was close to the saturation of the central chemoreflex. B, Relationship between the respiratory frequency and etCO2. C, Relationship between PND amplitude and etCO2. D, Relationship between the total respiratory outflow (f × A, product of PND amplitude and PND frequency, normalized to 100%) and etCO2. Each pair of vertically aligned symbols (a dot and a circle) derives from one episode of photostimulation such as shown in A1–A3. E, Relationship between the photoactivated increase in respiratory frequency and the respiratory frequency at rest. The graph is derived from the data shown in B. F, Relationship between the photoactivated increase in the amplitude of the PND and the PND amplitude at rest. The graph is derived from the data shown in C. G, Relationship between the respiratory response caused by each period of photostimulation (increase of the f × A product) and the resting level of respiratory activity (f × A). The graph is derived from the data shown in D. H, Changes in MAP and SND plotted as a function of etCO2. All panels are from the same rat.

