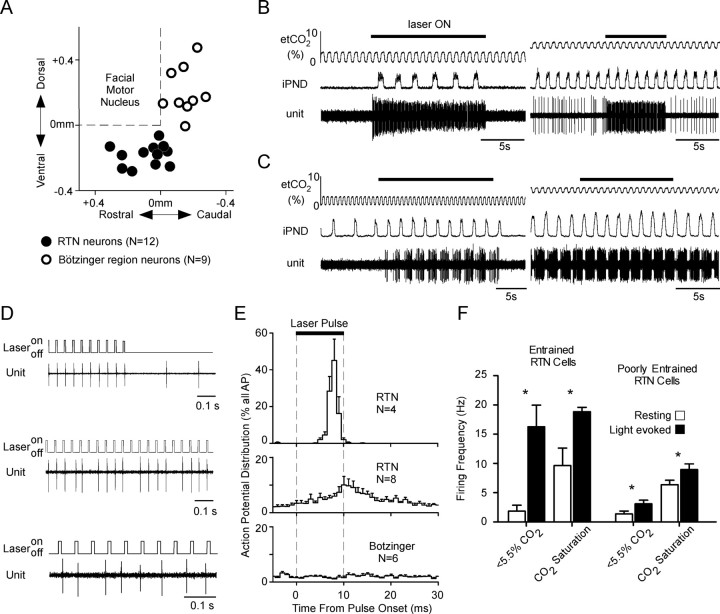
Figure 5.
Photoactivation of the CO2-responsive RTN neurons. A, Location of 12 CO2-activated neurons located in the RTN and 9 control respiratory cells located in the Bötzinger region of the ventral respiratory column. The location of the cells is plotted using their stereotaxic coordinates relative to the base and the caudal edge of the facial motor nucleus as determined by antidromic field potentials. The base of the brain is between 0.3 and 0.4 mm below the facial motor nucleus. B, Effect of a train of laser pulses (473 nm; 10 ms, 20 Hz) on a CO2-responsive RTN neuron recorded at low (left trace) and high level of end-tidal CO2 (right trace). C, Activation of a Bötzinger expiratory-augmenting neuron by photostimulation applied to the RTN region at low (left trace) and at high level of end-tidal CO2 (right trace). D, Top traces, Examples of two RTN neurons that were presumably directly photoactivated via ChR2. These cells fired a single action potential toward the end of almost every light pulse. Bottom trace, Bötzinger respiratory neuron, shown in C, which was presumably indirectly (i.e., synaptically) activated by the photostimulation of the RTN. The action potentials of this neuron were not synchronized with the light pulses. E, Probability histogram showing the distribution of action potentials occurring from 5 ms before the light pulses to 20 ms after the end of the light pulses. The histograms were built using the onset of the light pulses as trigger. The top trace describes four RTN neurons that were strongly synchronized with the light pulses; the middle trace describes the remaining eight RTN neurons. The bottom histogram represents six Bötzinger area respiratory neurons activated during photostimulation. F, Average discharge frequency of the RTN neurons at rest and during photostimulation. The four RTN neurons that were vigorously entrained by the photostimulation on a pulse-by-pulse basis are represented separately from the rest of the RTN neurons. The effect of photostimulation on the neuronal firing rate at low and high levels of end-expiratory CO2 are also represented. Error bars indicate SEM. Asterisks indicate statistically significant difference from resting (paired t test).

