
Figure 6.
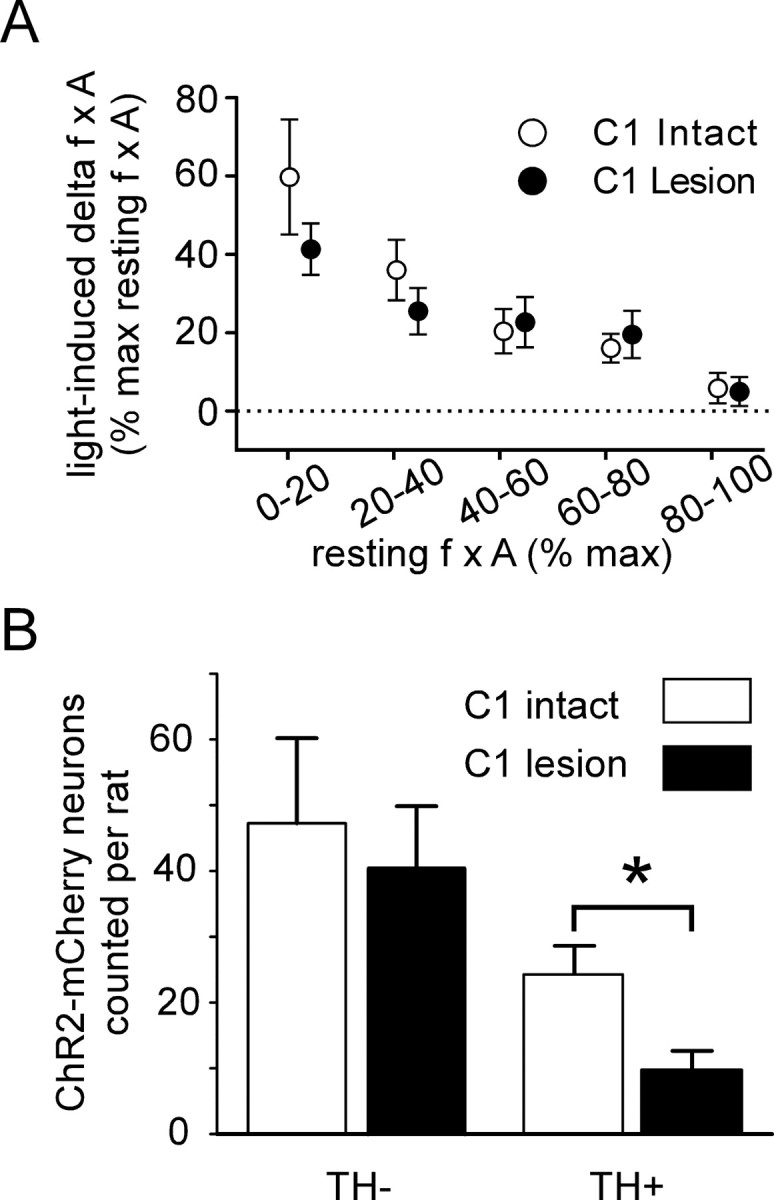
Cardiorespiratory effects produced by stimulating ChR2-expressing neurons in control rats versus rats with C1 cell lesions. A, Plot of the respiratory response (increase in f × A) to photostimulation as a function of the resting value of f × A. The f × A product was normalized as in Figures 3G and 4C, the 100% value representing the highest value observed at saturation of the chemoreflex. The respiratory response produced in control rats and in rats with lesions of the C1 neurons was the same (ns, two-way ANOVA). B, Total number of ChR2-mCherry-positive neurons counted in control and C1 lesion rats in a one-in six series of sections (actual numbers of neurons labeled per rat should be ∼6 times larger). The number of catecholaminergic neurons (TH-ir) that expressed the transgene was greatly reduced in the C1 lesion rats (p < 0.05 by unpaired t test), whereas the number of TH-negative neurons (RTN neurons) was the same (ns, unpaired t test). Error bars indicate SEM. The asterisk indicates statistically significant difference.