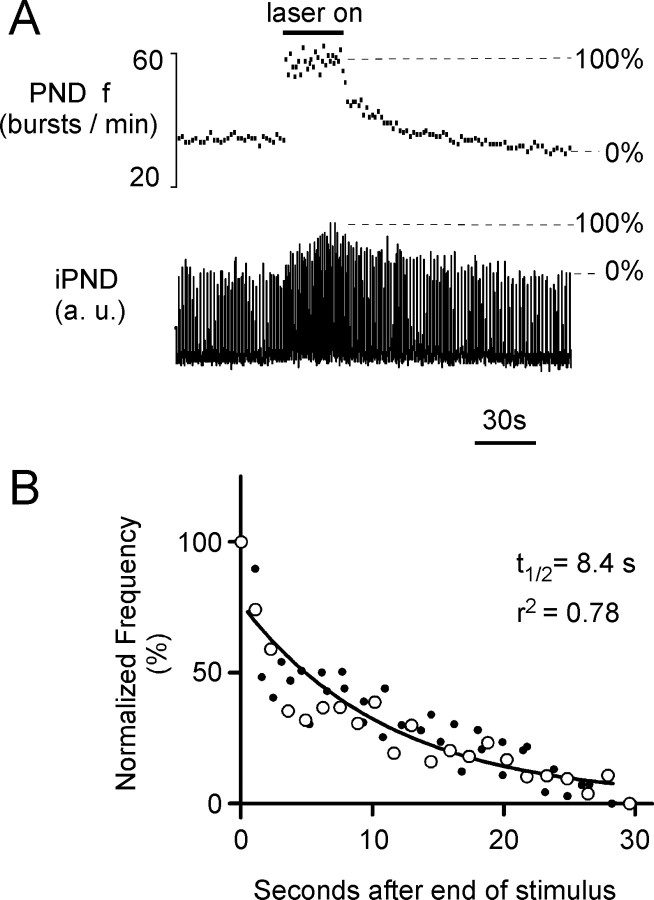
Figure 7.
Persistence of the respiratory response elicited by photostimulation of the ChR2-expressing neurons. A, Representative respiratory response to photostimulation of the RTN region in a urethane-anesthetized rat (473 nm, 20 Hz, 10 ms light pulses; transcerebellar optical fiber method). The drawing illustrates how the increase in PND amplitude and frequency were normalized. B, Relaxation of the frequency response after the end of the photostimulation period. The change in PND frequency is normalized as shown in A. The episode shown in A is represented by the open circles. The other episodes of photostimulation in the same animal are represented by small dots. The curve is the best single-exponential fit through all the points.

