Figure 8.
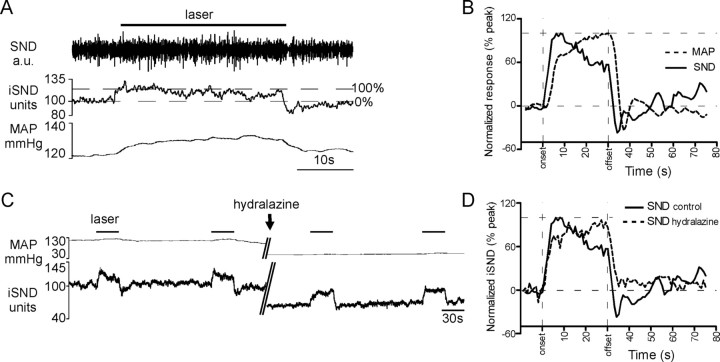
Kinetic properties of the sympathetic nerve response produced by photostimulation of the ChR2-expressing neurons. A, Representative cardiovascular response to a 30 s exposure of the RTN region to 473 nm, 20 Hz, 10 ms light pulses (transcerebellar optical fiber method). Top trace, Raw splanchnic sympathetic nerve discharge; middle trace, iSND (for units and calibration, see Materials and Methods); bottom trace, mean femoral arterial pressure (MAP). The drawing illustrates how the increase in SND amplitude was normalized across photostimulation episodes and rats. B, Averaged normalized cardiovascular responses to blue light photostimulation (SND and BP) before administration of the arteriolar vasodilator hydralazine. To generate these curves, a single curve was generated per rat by averaging up to six individual normalized responses using the onset of the photostimulation as a trigger. In a second step, the resulting curves were averaged across the five rats to produce the grand averages shown in this panel. C, Sympathetic nerve response before and after lowering BP with an intravenous injection of the vasodilator hydralazine (given at arrow during the 5 min break in the record) to eliminate the influence of the baroreflex on SND. D, Averaged normalized sympathetic nerve response to photostimulation before and after administration of hydralazine. In the presence of this agent, SND was maintained or further increased during the course of the stimulus indicating the absence of a baroreflex. The absence of the baroreflex also accounts for the loss of the undershoot present immediately after the end of the stimulus in the absence of hydralazine. In the presence of hydralazine, SND recovered to the baseline level within a few seconds after the end of the photostimulation.

