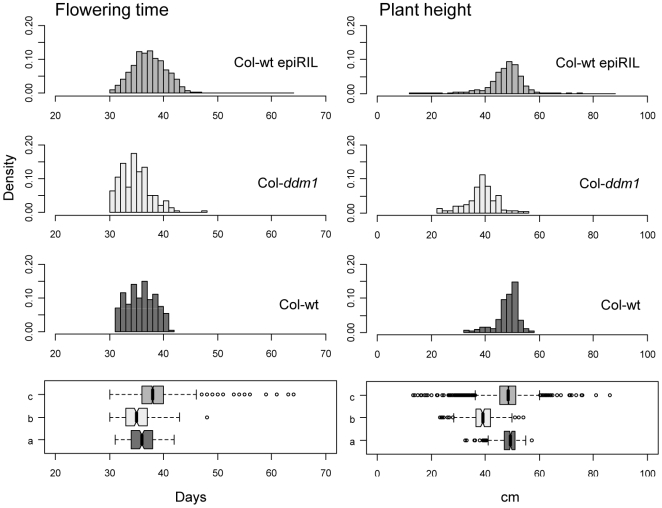
Figure 2. Phenotypic distributions.
Top panels: density histograms of raw phenotypic values for flowering time and plant height for the Col-ddm1 parental line, the Col-wt epiRILs, and the Col-wt parental line. The units on the x-axis are given in days and cm for these traits, respectively; the y-axis shows the density. Bottom panels: box-whisker plots for the three populations (a: Col-wt parental line; b: Col-ddm1 parental line; c: Col-wt epiRILs) with sample median; the whiskers mark off ±3 standard deviations from the mean; outlier data points are represented by open circles. A total of 16 individual Col-wt epiRIL plants were outliers (>3SD) for flowering time and 52 for plant height. These outliers mainly belong to a few Col-wt epiRILs lines (3 and 8 for flowering time and plant height, respectively) and were removed for subsequent heritability analysis.

