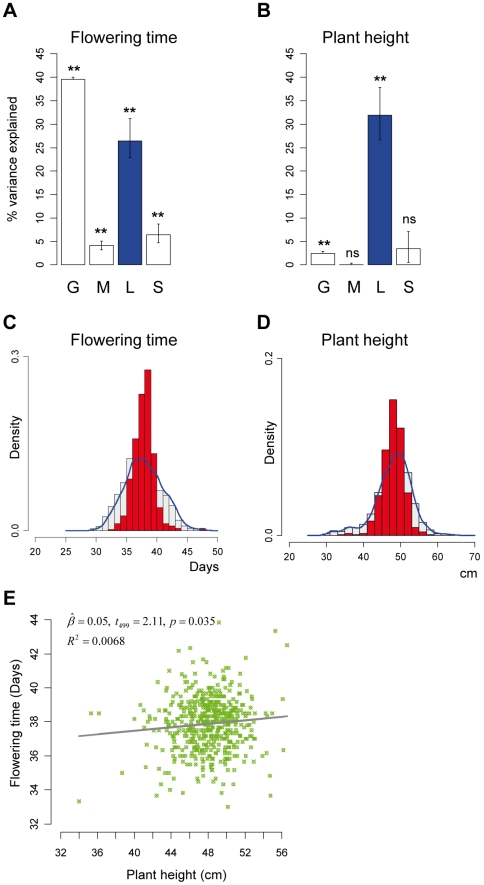
Figure 4. Estimates of heritable phenotypic variance.
(A,B) Percent of phenotypic variance explained by each of the tested variables and their 95% confidence intervals; G = Greenhouse effect; M = Micro-environment effect; L = Line-effect; S = Subline-effect. The effective samples sizes were 2856 and 2813 for flowering time and plant height, respectively. Outliers (>3SD) were removed from the analyses. (C,D) For the two traits, density histograms (red) of Col-wt epiRILs line means (‘genetic’ values) are superimposed over a density histogram of the total phenotypic variation (grey histogram with blue density line). By visual inspection, the distribution of the line means is continuous, suggestive of ‘polygenic’ variation for these traits. (E) Bivariate plot and least-squares fit (black line) of Col-wt epiRILs line means between plant height (x-axis) and flowering time (y-axis) reveals a negligible ‘genetic’ correlation, suggesting that these two traits have a largely distinct heritable basis; * p-value<0.0001; ns = not significant at α = 0.05 (Table S5).

