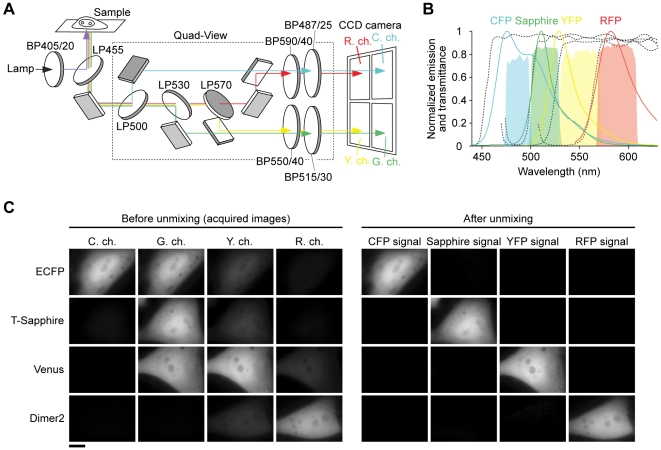
Figure 1. Microscope for simultaneous imaging of dual FRET pairs.
(A) Schematic representation of an optical setup with single excitation and four-color channel detection. LP, long pass dicroic mirror. BP, band pass excitation or emission filter. Numbers after LP and BP, wavelength and wavelength/half-bandwidth (nm), respectively. (B) Emission spectra of fluorescent proteins and transmittances of dichroic mirrors and emission filters. Broken lines from left to right indicate the transmission curves of LP455, 500, 530, and 570, and cyan, green, yellow, and red shaded areas represent of BP487/25, 515/30, 550/40, and 590/40 in (A). (C) Acquired images in each detection channel (left) and the images after linear unmixing (right) of HeLa cells expressing each fluorescent protein. Scale bar, 10 µm.

