
Fig. 8.
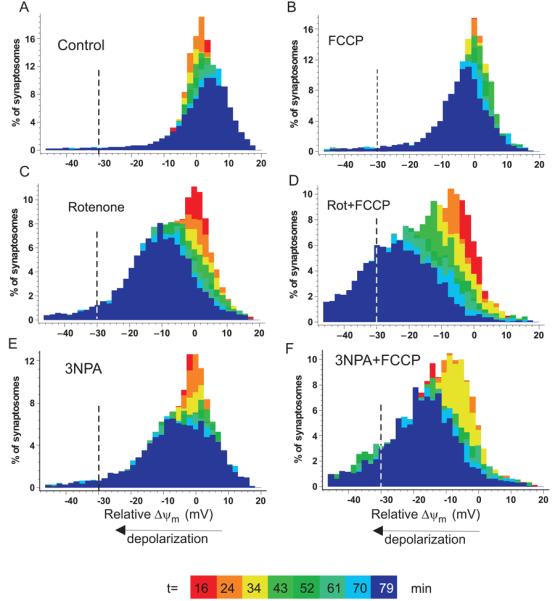
Decreased spare respiratory capacity by partial inhibition of Complex I or Complex II accelerates stochastic mitochondrial depolarization. Distribution of Δψm in individual synaptosomes. (A) control; (B) plus 150nM FCCP; (C) plus 10nM rotenone, (D) 10nM rotenone plus 150nM FCCP, (E) 200μM 3NPA (F) 200μM 3NPA plus 150nM FCCP. Colors code different time points after inhibitor addition, as indicated. Negative millivolts indicate the relative depolarization compared to the mean of the untreated control at the same time point. The line at −30mV depolarization represents the arbitrary threshold below which the mitochondria would be thermodynamically incapable of ATP generation.