
Figure 5.
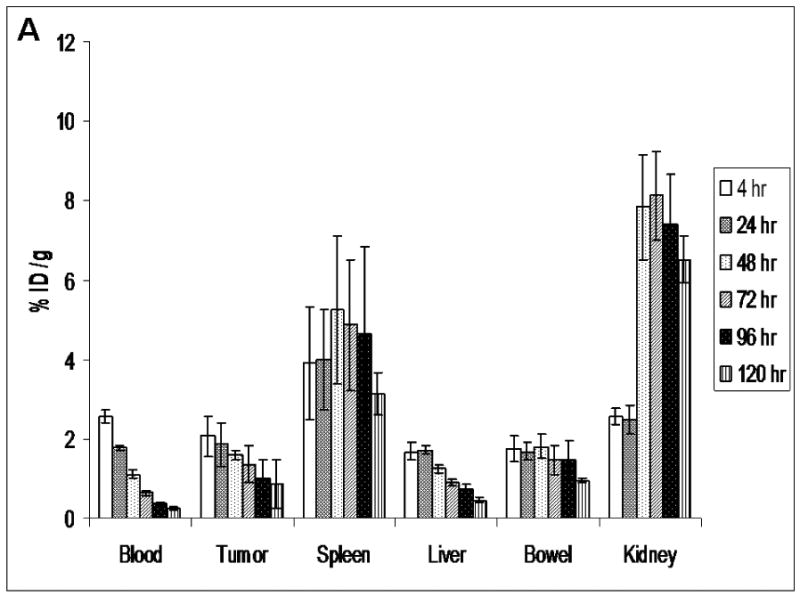
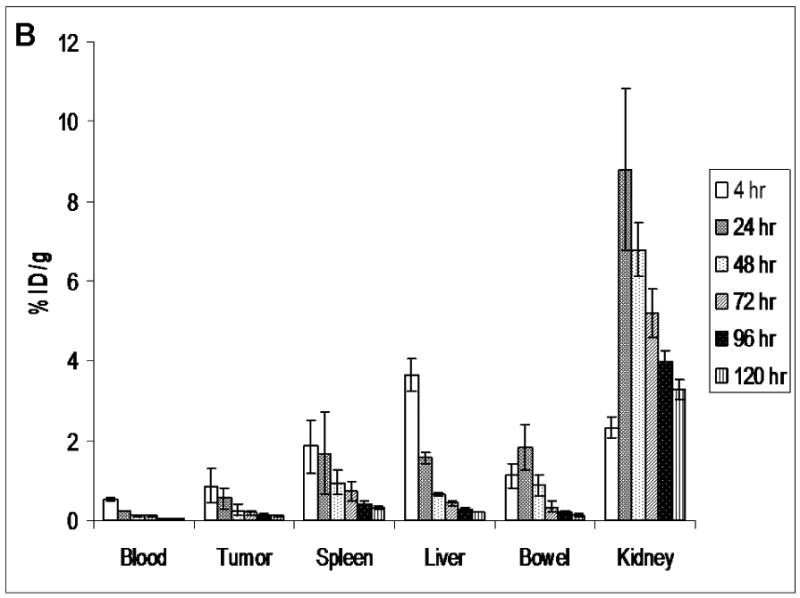
The distribution of 186Re-Doxil (A) and 186Re-PEG-liposomes (B) at various time points determined from planar image analysis. The %ID/g in blood, tumor and spleen are significantly higher for 186Re-Doxil. Data represented as mean ± SD. (n=4 at each time point and for each group).