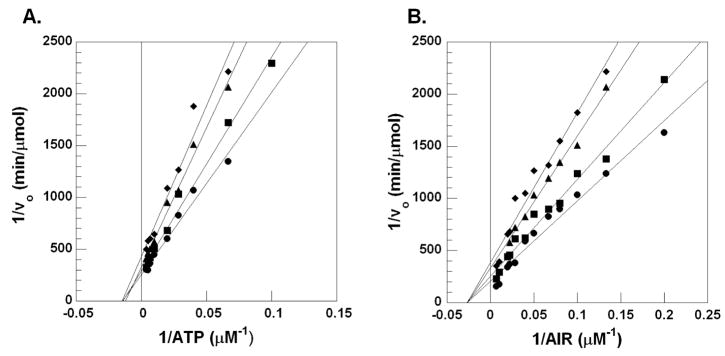
Figure 4.
Lineweaver-Burke plots for the inhibition of N5CAIR synthetase by 7. A. Lineweaver-Burke plot with varied concentration of ATP, fixed concentration of AIR and various concentrations of 7 ((●) 0 μM, (■) 5μM, (▲) 10μM, (◆) 25μM). B. Lineweaver-Burke plot with varied concentration of AIR, fixed concentration of ATP and various concentrations of 7 ((●) 0μM, (■) 5μM, (▲) 10μM, (◆) 25μM).

