Table I.
Kinetic information for inhibitors identified by high-throughput screening.
| No. | Structure | Classa | IC50b | Kic | Typed | No. | Structure | Classa | IC50b | Kic | Typed |
|---|---|---|---|---|---|---|---|---|---|---|---|
| 1 |

|
I | 2.3 | NAe | R | 8 |

|
II | 19 | ND | NA |
| 2 |
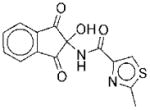
|
I | 5.6 | NAe | R | 9 |
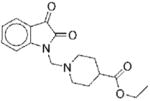
|
II | 22 | ND | NA |
| 3 |

|
I | 7.8 | ND | NA | 10 |
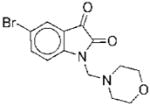
|
II | 23 | ND | NA |
| 4 |
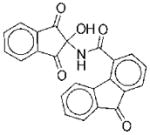
|
I | 8.7 | ND | NA | 11 |
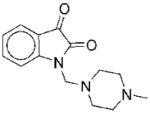
|
II | 37 | ND | NA |
| 5 |

|
I | 17 | ND | NA | 12 |

|
II | 69 | ND | NA |
| 6 |

|
I | 17 | ND | NA | 13 |

|
III | 10 | 62f 43g |
Cf Ug |
| 7 |
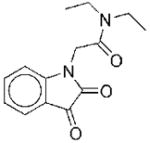
|
II | 10.5 | 29f 40g |
NCf NCg |
14 |
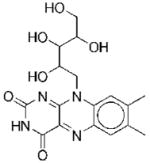
|
III | 20 | 81f 122g |
NCf NCg |
compound class was determined based upon structural similarity to other hits identified in the screen.
IC50 values determined from dose response curves using the phosphate assay.
Ki values determined using the ATPase assay with variable amounts of either AIR or ATP at a fixed concentration of bicarbonate. Values determined by curve fitting data using various models of inhibition.
type of inhibition determined by fitting data to the modified Michaelis-Menten equations for the presence of different types of inhibitors. Equations which produced the best fit to the data were used to determine the type of inhibition. Results of these curve fits were validated by Lineweaver-Burke plots. R: reacts with substrate; NC: non-competitive; C: competitive; U:uncompetitive.
the compounds react with substrate and thus do not follow normal Michaelis-Menten kinetics.
obtained using variable concentrations of AIR and fixed ATP and bicarbonate concentrations.
obtained using variable concentrations of ATP and fixed AIR and bicarbonate concentrations.
