
Figure 1. Evidence for proliferation of EGFP+NG2+ cells after spinal cord injury.
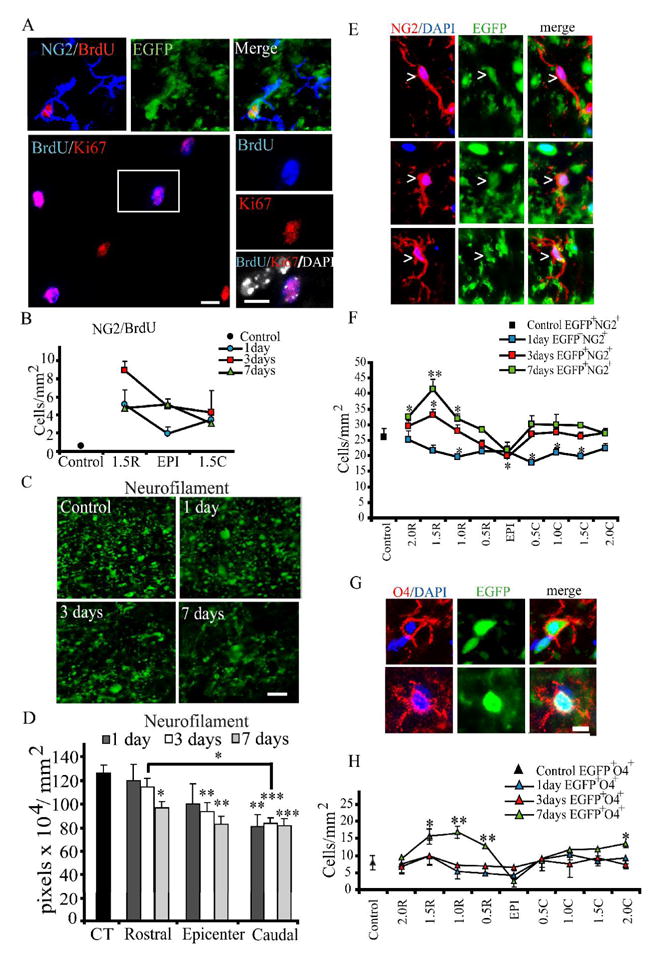
A. BrdU incorporation (red) in EGFP+ (green) NG2+ (blue) cells. BrdU incorporation (blue, bottom panels) always occurs in Ki67-expressing (red) cells and is always nuclear, as indicated by labeling with DAPI (white). Tissue shown is from the rostral spinal cord, 3DPI. Scale bar = 10μm.
B. Quantitative analysis of EGFP+NG2+BrdU+ cells (bottom panel) in control animals and at 1, 3 and 7 DPI at 1.5mm rostral, injury epicenter, and 1.5mm caudal. Cell counts were performed in the ventral-lateral white matter. Immunoreactive cells were quantified from 5 animals at the injury epicenter, and at 1.5mm rostral and caudal in the spared ventral-lateral white matter. For each distance at each timepoint, three 10 μm-thick sections were counted, left and right hemispheres, for a total of six fields per animal. Therefore, thirty 200 μm2 fields of view were quantified for each. One-Way ANOVA with Tukey’s post-hoc analysis for variance. * p < 0.05; ** p < 0.01; *** p < 0.001 vs. control.
C–D. The proliferative response of EGFP+NG2+ cells is correlated to neurofilament (NF) immunoreactivity (IR). Representative NF staining in the spared ventral lateral white matter at the injury epicenter in control and 1, 3 and 7 days post-injury and quantification of NF immunoreactivity (pixels/mm2) at 1.5mm rostral and caudal and at the injury epicenter. There is degradation of NF structure by 1 DPI, with significant loss at 3 and 7 days. IR was quantified for 5 animals at the injury epicenter and at 1.5mm rostral and caudal in the spared ventral-lateral white matter. For each distance at each timepoint, three 10 μm-thick sections were counted, left and right hemispheres, for a total of six fields per animal. Therefore, thirty 200 μm2 fields of view were quantified for each. There is significant loss in the caudal cord at all timepoints examined. Loss at the epicenter is significant at 3 and 7 days, and in the rostral cord at 7 days. * p<0.05, ** p<0.01, *** p<0.001 vs. control. There is a significant difference between the rostral and caudal cords at 3 days (p<0.05). Bars represent mean ± SEM. Two-way ANOVA with Bonferroni’s post-hoc analysis. Scale bar = 5μm.
E. EGFP-expressing (green) NG2 (red) cells (arrowheads) are typically bipolar (top panels, uninjured tissue shown) or have very few branches (middle panels, injured tissue shown 3 DPI). Occasionally, cells have more complex branching (bottom panels, uninjured tissue shown). DAPI (blue) labels cell nuclei. Scale bar = 10μm.
F. Cell counts in control and injured animals for EGFP+NG2+ cells every 0.5 mm from the injury epicenter, up to 2 mm rostral and caudal. There is a significant increase in EGFP+NG2+ cells in the rostral spinal cord at 3 and 7 dpi. One-Way ANOVA with Tukey’s post-hoc analysis for variance. * p < 0.05; ** p < 0.01 vs. control.
G. Preoligodendrocytes labeled with O4 (top panels) express EGFP. Scale bar = 10μm.
H. There is a significant increase in EGFP+O4+ cells in the rostral spinal cord at 7 dpi. One-Way ANOVA with Tukey’s post-hoc analysis for variance. * p < 0.05; ** p < 0.01 vs. control.