
Figure 2. Electrophysiological analysis of EGFP+NG2+ cells after spinal cord injury indicates an OPC-like phenotype.
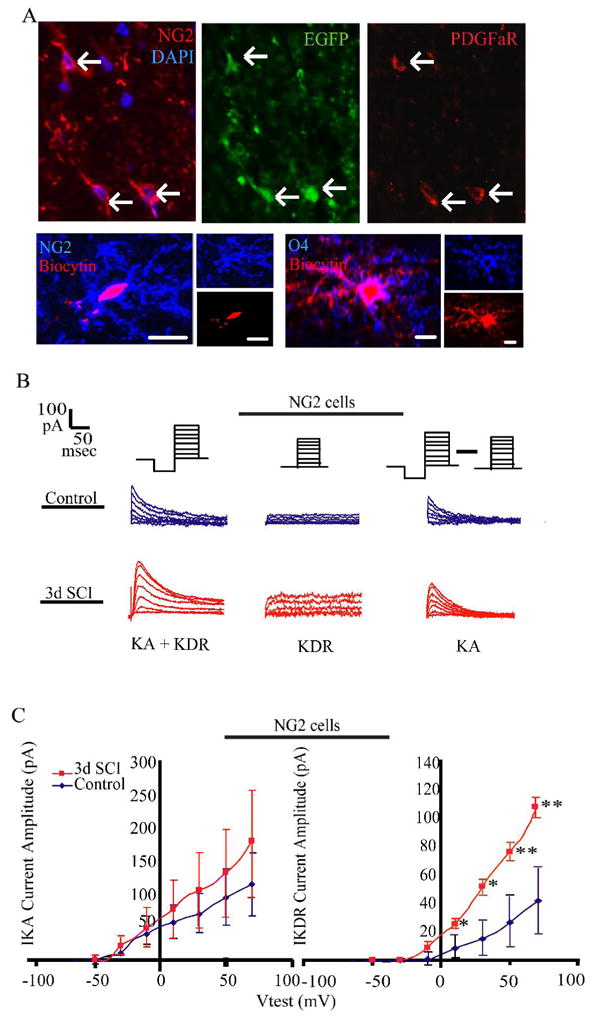
A. Immunostaining for NG2 and PDGFα R identifies EGFP+ OPC-like cells. Expression of PDGFαR was observed on NG2 cells, but was weak and limited to the cell body. After electrophysiological analysis, cells were filled with biocytin (red) for post-hoc immunocytochemical analysis to distinguish between EGFP+NG2+ (blue, top panels) and EGFP+O4+ (blue, bottom panels) stage cells, and to confirm identification of EGFP+NG2+ cells.
B. Proliferative electrophysiological phenotype of EGFP+NG2+ cells in the rostral spinal cord of uninjured and injured animals at 3 DPI. Representative traces from EGFP+NG2+ cells depicting total outward current (KA + KDR, top panel), isolated KDR (middle panel) and isolated KA (bottom panels) for control (left panels) and 3-day injured (right panels) cells.
C. Current-voltage curves constructed from a series of depolarizing voltage steps from −70mV to 70 mV; 10mV increments. Holding potential was −60mV. For isolation of KA, KDR amplitude was digitally subtracted from the total outward current. For KDR, this followed a pre-pulse to −40mV to inactivate KA. All values are after junction potential correction. N = 32 cells for control, and 32 cells for injured. Prior to recording, series resistance compensation to at least 75% was performed. Symbols represent mean ± SEM.