
Figure 3. EGFPnegNG2+ cells also proliferate after spinal cord injury and do not resemble OPCs.
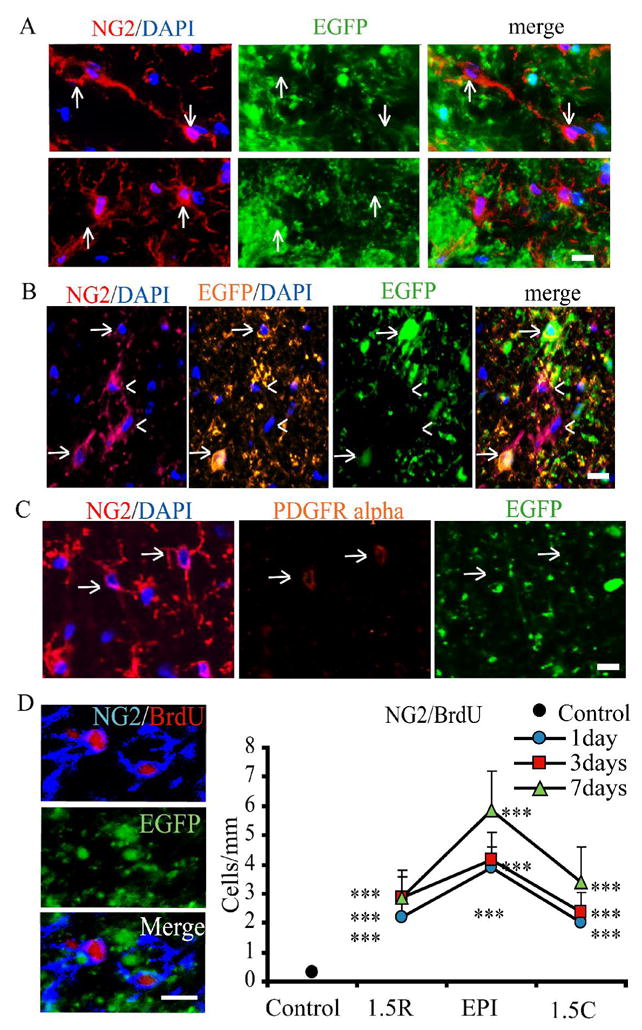
A. Non-EGFP-expressing NG2 (red) cells (arrows) range in morphology from simple, bipolar (top panels, injured tissue shown 3 DPI) to branched, multipolar (bottom panels, uninjured tissue shown). DAPI (blue) labels cell nuclei. Scale bar = 10μm.
B. Non-EGFP-expressing NG2+ cells (arrow heads) are negative for anti-EGFP (orange). EGFP+NG2+ cells can also be seen (arrows) and are immuno-positive for GFP. Scalebar = 10μm.
C. Non-EGFP-expressing NG2+ cells express PDGFRα. However, expression is weak and was limited to the cell body.
D. BrdU (red) is incorporated into EGFPnegNG2+ cells (blue) in the first week after injury. Scale bar = 10um. Quantitative analysis of EGFPnegNG2+BrdU+ cell counts in control animals and after injury. Cell counts were performed in the ventral-lateral white matter. Immunoreactive cells were quantified for 5 animals every at the injury epicenter and at 1.5mm rostral and caudal in the spared ventral-lateral white matter. For each distance at each timepoint, three 10 μm-thick sections were counted, left and right hemispheres, for a total of six fields per animal. Therefore, thirty 200 μm2 fields of view were quantified for each. One-Way ANOVA with Tukey’s post-hoc analysis for variance. * p < 0.05; ** p < 0.01; *** p < 0.001 vs. control.