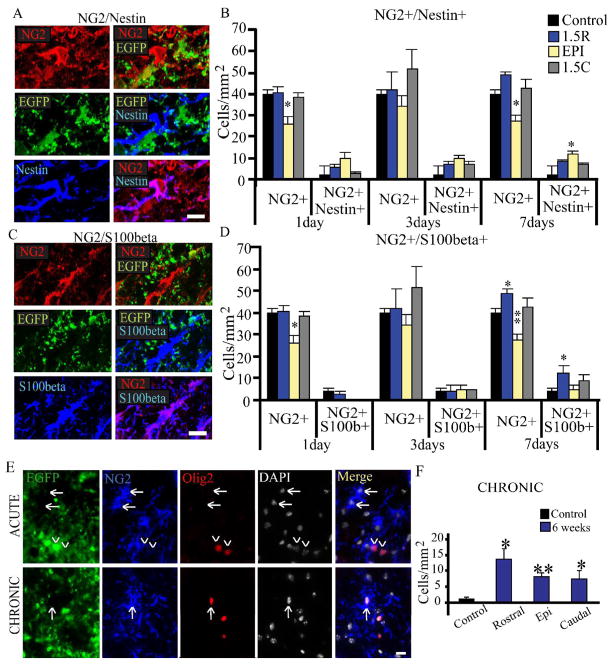
Figure 4. The EGFPnegOlig2+ cell population displays different patterns of expression of S1008, nestin, and transcription factors associated with OPCs.
A. Example of a nestin+ (blue) EGFPneg (green) NG2+ (red) cell in the ventrolateral white matter in injured tissue at 3 DPI. Scale bar = 10μm.
B. Quantitative analysis for EGFPnegNG2+nestin+ cells (top) in the control animal and in the injured animal at 1, 3 and 7 DPI, at 1.5mm rostral, epicenter, and 1.5mm caudal. Cell counts were performed in the ventral-lateral white matter. A side-by-side comparison for EGFPnegNG2+ and EGFPnegNG2+nestin+ cells is shown for each timepoint. Immunoreactive cells were quantified for 5 animals every 0.5 mm from the injury epicenter, and at the injury epicenter in the spared ventral-lateral white matter. For each distance at each timepoint, three 10 μm-thick sections were counted, left and right hemispheres, for a total of six fields per animal. Therefore, thirty 200 μm2 fields of view were quantified each. One-Way ANOVA with Tukey’s post-hoc analysis for variance. * p<0.05, ** p<0.01 vs. control.
C. Example of S100β+ (blue) EGFPneg (green) NG2+ (red) cells in the ventrolateral white matter in injured tissue at 3 DPI. Scale bar = 10μm.
D. Quantitative analysis for EGFPnegNG2+S100β+ cells in the control animal and in the injured animal at 1, 3 and 7 DPI, at 1.5mm rostral, epicenter, and 1.5mm caudal. Cell counts were performed in the ventral-lateral white matter. A side-by-side comparison for EGFPnegNG2+ and EGFPnegNG2+S100β+ cells and is shown for each timepoint. A subset of EGFPnegNG2+ cells express S100β. Immunoreactive cells were quantified for 5 animals every 0.5 mm from the injury epicenter, and at the injury epicenter in the spared ventral-lateral white matter. For each distance at each timepoint, three 10 μm-thick sections were counted, left and right hemispheres, for a total of six fields per animal. Therefore, thirty 200 μm2 fields of view were quantified each. One-Way ANOVA with Tukey’s post-hoc analysis for variance. * p<0.05, ** p<0.01 vs. control.
E. Representative images of Olig2 staining in EGFPnegNG2+ cells, acutely and chronically. Olig2 was not observed in the acute injury phase, but was observed chronically.
F. Quantification of EGFPnegOlig2+ cells in the chronic animal. Immunoreactive cells were quantified for 5 animals every 0.5 mm from the injury epicenter, and at the injury epicenter in the spared ventral-lateral white matter. For each distance at each timepoint, three 10 μm-thick sections were counted, left and right hemispheres, for a total of six fields per animal. Therefore, thirty 200 μm2 fields of view were quantified for each. Represented as mean ± SEM. One-Way ANOVA with Tukey’s Post-hoc test Symbols represent mean ± SEM. One-way ANOVA with Tukey’s post-hoc analysis. * = p<0.05, ** = p<0.01 vs. Control.

