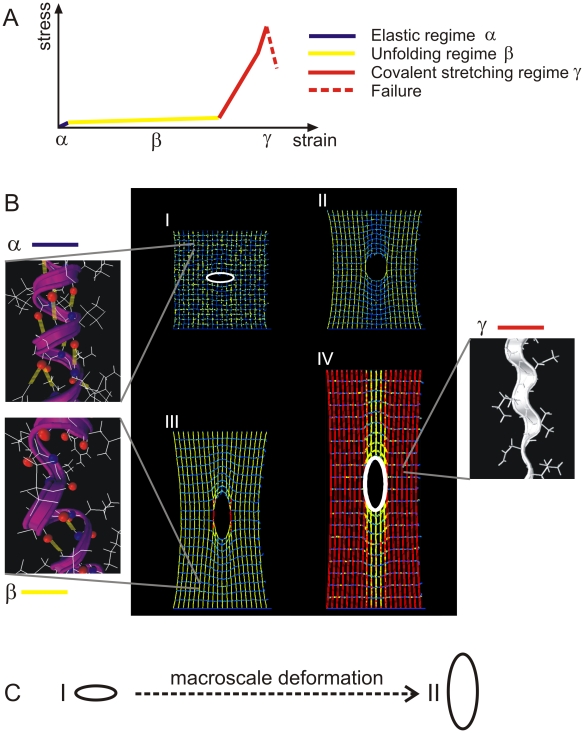
Figure 6. Snapshots of the protein network deformation.
Panel A shows a schematic of the characteristic force-extension curve of a single alpha helix (consisting of three regimes) to provide the color code for the snapshots shown below. Panel B shows snapshots of the network with crack at different laterally applied strains (snapshot numbering refers to points shown in Figure 4). The deformation mechanism of the network is characterized by molecular unfolding of the alpha-helical protein domains, leading to the formation of very large plastic yield regions. These plastic yield regions represent an energy dissipation mechanism to resist catastrophic failure of the system. Once the entire structure reaches the rupture strain the crack propagates, leading to catastrophic failure, characterized by breaking of backbone atomic bonds as shown in the circled areas I and II. The white ellipsoids in the first and the last snapshot highlight the crack shape transformation that occurs during deformation (they show the surface geometry of the crack). The blowups show the nanoscale structural arrangements of the alpha-helical protein filaments under different levels of strain. The α structure is an intact helix, with 3–4 H-bonds per turn (yellowish thick lines). The β structure is a partially unfolded alpha-helix, with some of the H-bonds broken along the filament axis whereas others are still intact. The γ structure shows a completely unfolded alpha-helix, where the protein's backbone is being stretched. These three structures correspond to the color codes blue, yellow and red, respectively. Panel C shows the change of the crack geometry under macroscale deformation (crack shapes correspond to the white ellipses in panel B).

