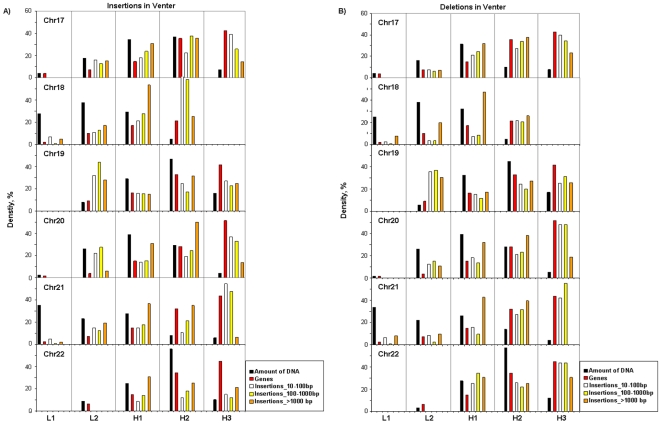
Figure 3. Insertions/deletions in Venter's chromosomes.
For each chromosome the amounts of DNA (in percentage of the total; black bars) and the densities of genes (red bars), insertions (A) and deletions (B) (in the three size classes 10–100 bp, 100–1000 bp, >1000 bp; white, yellow and orange bars) are reported for the five isochore families of Venter's chromosomes. The slightly different amounts of DNA in isochore families between (A) and (B) are related to the fact that deletions in Venter's chromosomes are seen as insertions in the reference chromosomes, and the latter are slightly different from Venter's chromosomes because of insertions and deletions. In some cases in which DNA amounts are very low (such as in L1 of chromosomes 17 and 20, and L2 of chromosomes 22) the insertion/deletion densities were not reported (see, however, Supplementary Table S1).

