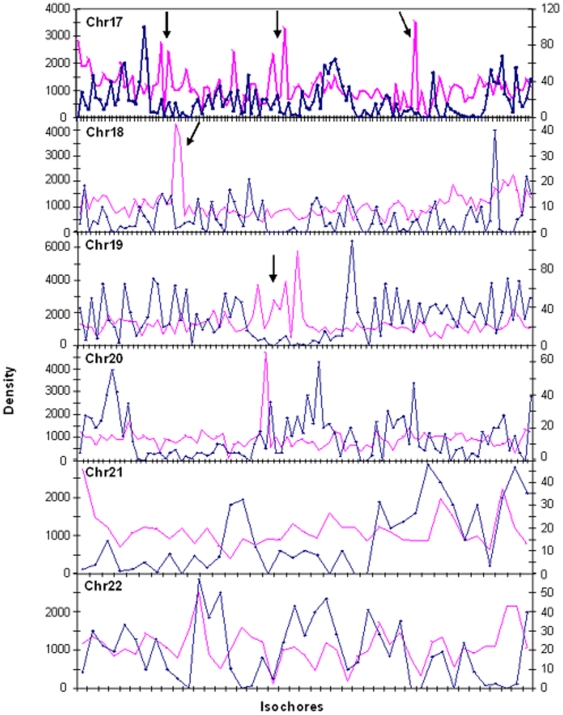
Figure 8. SNPs and gene densitites.
Each point corresponds to an isochore. SNPs density (pink line) is compared with gene density (blu line) for chromosomes 17–22. Arrows show some of the opposite trends of densities. For the coordinates and the nomenclature of isochores on x-axes see Supplementary Table S1 of ref. 15 (see also legend to Figure 6).

