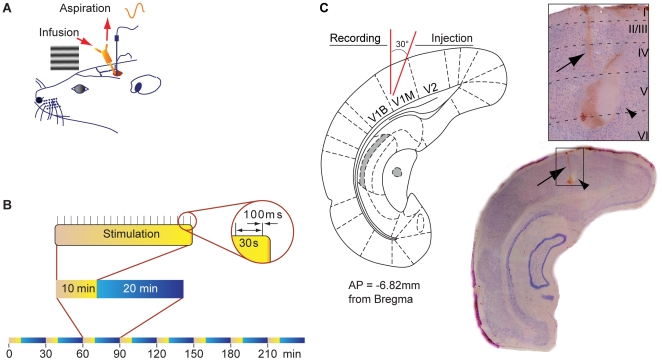
Figure 1. Design of the experiment.
(A) Schematic diagram illustrating the chronic implantation of the recoding electrode in V1 and the push-pull cannula guide as well as the lateral stimulation of the retina with a horizontal grating displayed on a computer screen. The push-pull cannula guide and the recording electrode guide were implanted in visual cortex 2 days before VEP recording. (B) Visual stimulation. Rats were stimulated by displaying trains of sinusoidal horizontal grating (100 ms, 0.033 Hz, contrast 100%) for 8 cycles. Each cycle consisted of 10 min visual stimulation every 30 min. The VEP was obtained by averaging the 20 single electrophysiological signals evoked by the 20 presentations of the grating during the stimulation period. (C) Histology of the injection and recording sites. Schematic coronal section at the site of recording and cresyl violet-stained coronal section showing electrolytic lesion indicating position of electrode tip (arrow) and location of the infusion cannula (arrow head). Electrode and cannula tips are adjacent.

