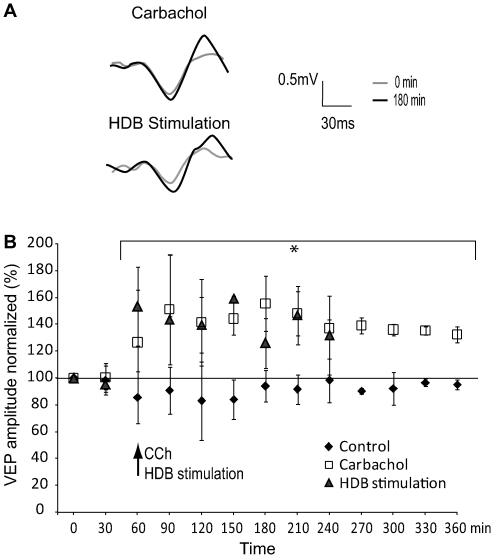
Figure 2. Effects of cholinergic system activation on VEPs amplitude.
Cholinergic activation was performed through pharmacological injection or electrical stimulation paired with visual stimuli. (A) Representative wave of the VEP recorded before (grey line) and after (black line) CCh injection or HDB stimulation. The recorded wave was composed of a negative peak followed by a positive deviation representative of layer 4 field potentials trace. (B) Long-term effect on VEP amplitude of CCh infused in V1 (open square) or of HDB stimulation (triangle). After 2 periods of baseline recording (0 and 30 min), application of CCh or HDB stimulation (indicated by arrow) produces an increase of VEP amplitude observed for several hours after CCh infusion or HDB stimulation. Error bars indicate the SD values.

