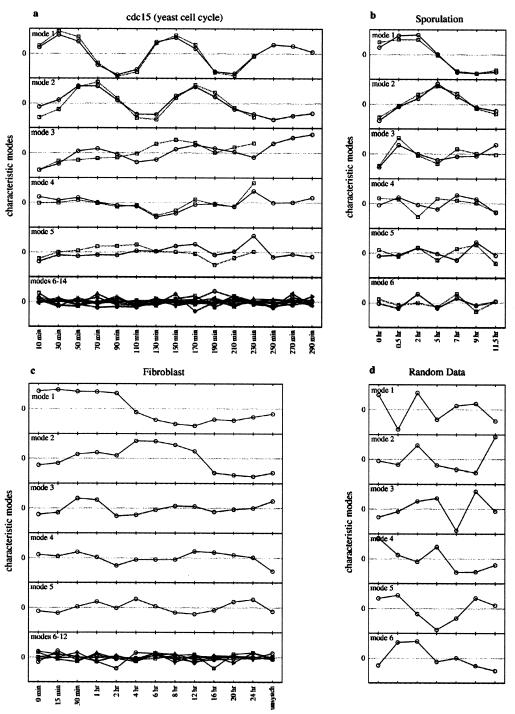
Figure 1.
Characteristic modes (Xi(t)) for the gene expression and random data sets. (a) Yeast cell cycle data (3). The circles correspond to the 15 time-point series, and the squares in the first five panels correspond to a truncated time series with only 12 time points. The bottom panel is an overlay of modes 6–15 for the 15 time-point series only. (b) Yeast sporulation data (5). The circles correspond to modes generated from sporulation specific genes whereas the squares correspond to modes generated from genes in the complete data set (entire yeast genome). (c) Human fibroblast data (4). The format is the same as in a, except that the bottom panel is an overlay of modes 6–12. (d) Random data with the same number of genes and time points as the sporulation data.

