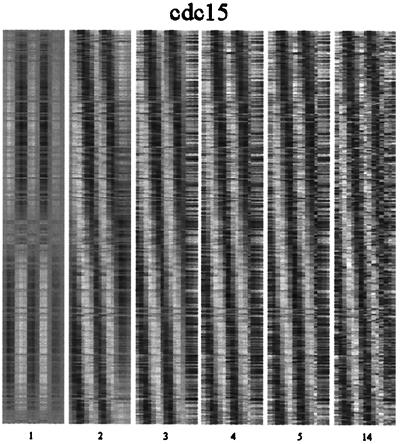
Figure 2.
A reconstruction of the expression profiles for the yeast cell cycle data set from the characteristic modes. Panels 1–5 show the results of a hierarchical reconstruction of the expression profiles using only the first 1, 2, 3, 4, and 5 characteristic modes. The last panel uses all 14 characteristic modes and exactly reproduces the original data set. Each row in each of the panels represents a different gene, and each column represents a different time point. The gray scale ranges from white (maximal expression) to black (minimal expression). The genes are ordered as in ref. 3.

