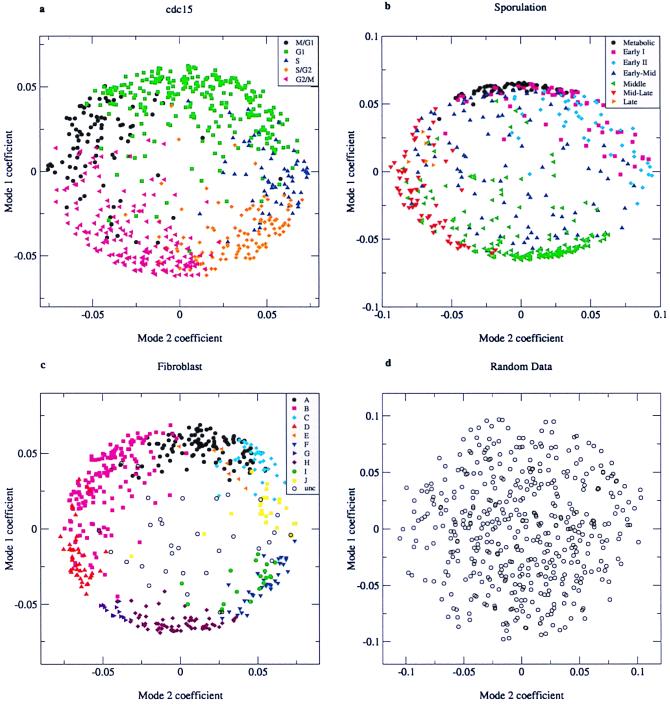
Figure 5.
Plot of the coefficients for characteristic mode 1 against the coefficients for characteristic mode 2. Symbols of different colors and shapes are used for genes that belong to the different clusters identified by the original authors (3–5). (a) cdc15 data (first 12 time points). (b) Sporulation data (7 time points). (c) Fibroblast data (13 time points). (d) random data (7 time points).

