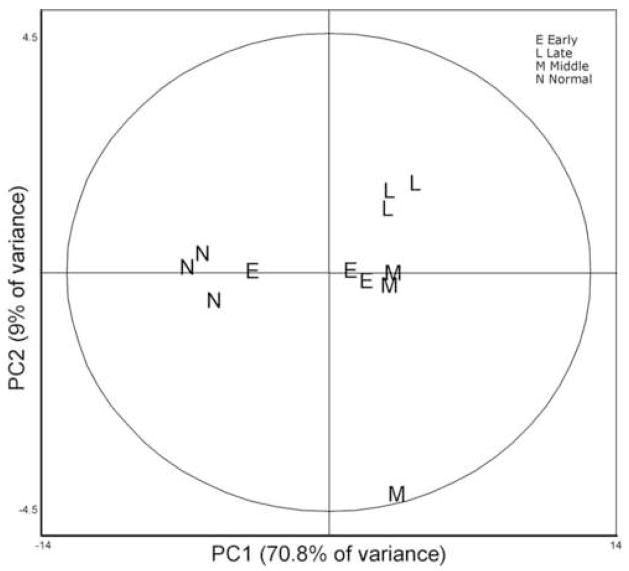
Figure 1.
Unsupervised Principal Component Analysis of individual sample expression maps each consisting of 196 features with ANOVA p < 0.05): A graphical display of the relationship of each sample to one another. No prior sample assignments were made. Data were generated strictly by relative protein abundance data generated from the Biological Variance Analysis. The software shows, without any preconception of sample nature, that the dynamic portions of the sample proteomes are distinct and distinguishable enough to be categorized into a control and 3 temporal groupings.

