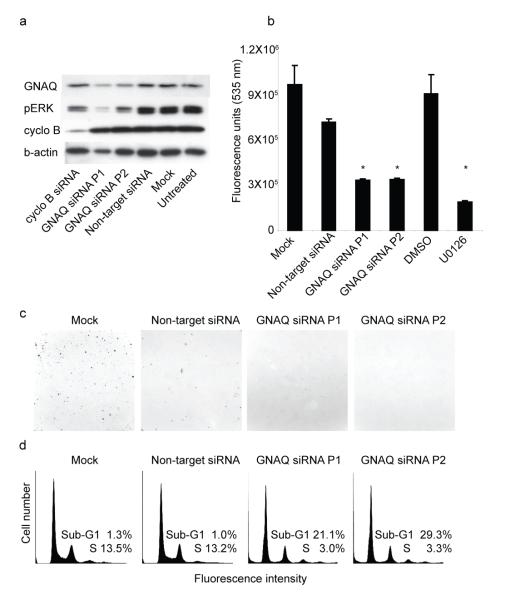
Figure 3. Knockdown of GNAQ in OMM1.3 cells results in MAP-kinase inhibition, reduced growth and apoptosis.
a, Western blot after treatment with 2 pools of siRNAs against GNAQ shows decreased pERK levels compared to control treated cells: cyclophilin B and non-target siRNA. b, After 72 hours, GNAQ knockdown results in marked reduction of cell numbers, similar to the effect of MEK inhibitor U0126. Bars show means and standard error of five replicate assays. * p<0.05, t-test compared to mock or vehicle control, respectively. c, GNAQ knockdown reduces the number of colonies (upper left corner) formed in soft agar. d, Cell cycle profiles showing an increase of the sub-G0/G1 population after GNAQ knockdown.

