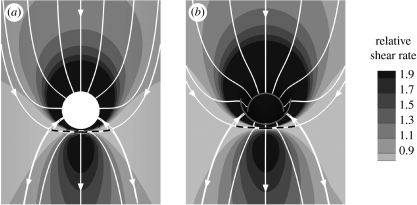
Figure 4.
Magnitude and direction of non-dimensionalized aortic WSS around the ostium of (a) the aortic model of figure 1b and (b) the realistic aorto-intercostal junction of figure 1c. Mean aortic flow is from top to bottom. The simulations were performed for Re=500 and Qb : Qa=0.79%. Dashed lines indicate flow attachment.

