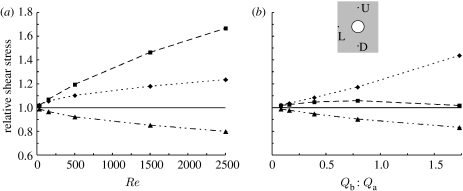
Figure 7.
Change in WSSn with (a) Re (for Qb : Qa=0.08%) and (b) flow partition (for Re=30), measured at three locations on the aortic wall for the simple geometry of figure 1a: at distances 1D upstream (U) of the ostial lip, 1D downstream (D) of it and 1D lateral (L) to it (inset). Dotted line with diamond, U; dashed line with square, D; dot-dashed line with triangle, L.

