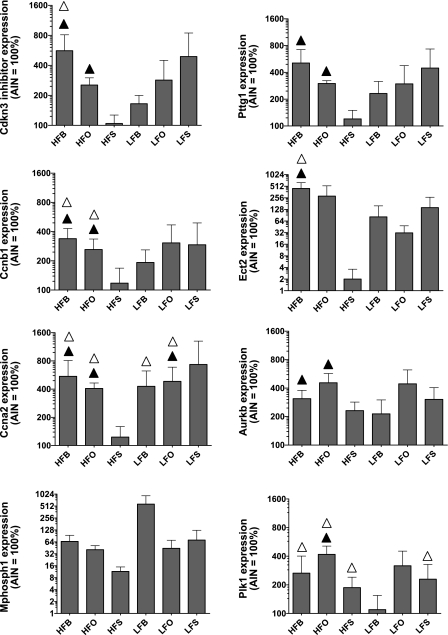
Fig. 1.
Quantitative PCR validation of differential expression for key gene at day 50. The data are represented as the percent increase over the control diet. Triangles represent statistically significant differential expression at P value <0.1 using the nonparametric Wilcoxon test (▴) and using the simple t-test (▵). Diets: HFB, high fat butter; HFO, high fat olive oil; HFS, high fat safflower oil; LFB, low fat butter; LFO, low fat olive oil; LFS, low fat safflower oil.

