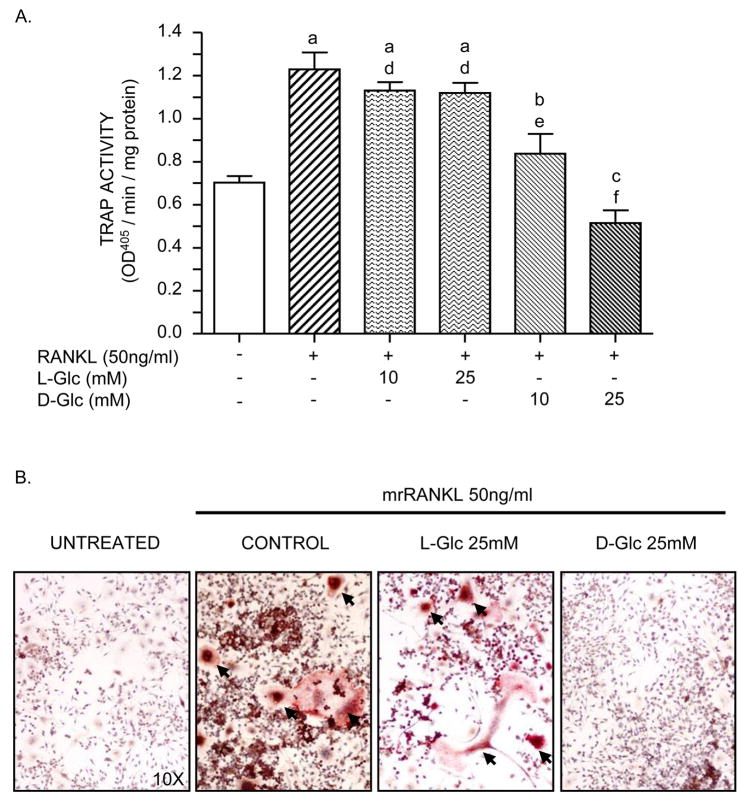
Figure 1. Effect of glucose on TRACP activity.
RAW264.7 cells were seeded at a density of 1×10⁴ cells/cm2 and incubated 6 days in: alpha-MEM, 2% FCS (untreated), differentiation medium (RANKL 50ng/ml; control), differentiation medium with L-Glc or differentiation medium with D-Glc (10mM and 25 mM in A; 25 mM in B). The medium was changed every 2 days. A) TRACP assay. TRACP activity was assayed using p-nitrophenyl phosphate as a substrate and the optical density at 405 nm was determined by spectrophometry (100μl final). B) TRACP histochemical stain. Cells were fixed and stained to identify TRACP-positive multinucleated cells (arrows). Photomicrographs of TRAP stained cultures are representative of three independent experiments. Values are means +/− S.E. of three independent experiments. a (p)<0.001, b (p)<0.05, c (p)>0.05 vs untreated cells; d (p)>0.05, e (p)<0.01, f (p)< 0.001 vs control cells.

